Question
Question: The population $N(t)$ of ill patients during an epidemic in a country is given by the following equa...
The population N(t) of ill patients during an epidemic in a country is given by the following equation
N(t)=1+N0(exp(t/τ)−1)/NsN0exp(t/τ)
where N0 is the initial population of ill patients, Ns≫N0 is a large number and τ is a positive constant. The sketch which describes it best is
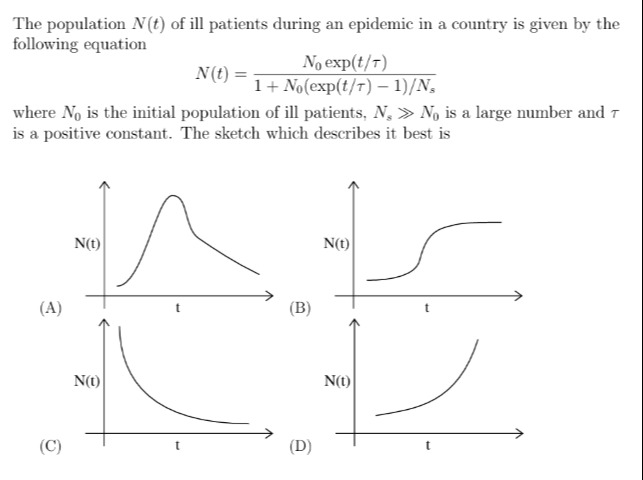
Graph A shows a population that increases, reaches a peak, and then decreases.
Graph B shows an S-shaped curve, starting at a positive value, increasing, and then flattening out as it approaches a saturation value.
Graph C shows a decreasing population (exponential decay).
Graph D shows an exponentially increasing population without any saturation.
Graph B shows an S-shaped curve, starting at a positive value, increasing, and then flattening out as it approaches a saturation value.
Solution
The given equation is a logistic function.
- At t=0, N(0)=N0.
- As t→∞, N(t) approaches Ns (a finite saturation value).
- The derivative dtdN is always positive, meaning N(t) is always increasing.
These properties describe an S-shaped curve, where the population starts at N0, grows, and then the growth rate slows as it approaches the carrying capacity Ns. Graph B depicts this behavior.