Question
Question: The points of scatter diagram in perfect positive correlation are situated at the line: A. \[y=-x\...
The points of scatter diagram in perfect positive correlation are situated at the line:
A. y=−x
B. y=x
C. y=2x
D. y=−2x
Solution
First of all we will describe the types of correlation that is positive correlation and negative correlation and we will draw the scatter diagram and graph for both of these correlations along with x−axis and y−axis then check which option is correct in the above given options.
Complete step-by-step solution:
Correlation was developed by Francis Galton in 1885 . A correlation is a measure of the association or the relationship that exists between two variables. It measures three characteristics of the relationship between two variables.
Direction of relationship that is positive or negative
Form of relationship that is linear or nonlinear
Degree of relationship
The measure of the extent of relationship between two variables is shown by the correlation coefficient. Regression is a technique used for the modeling and analysis of numerical data. Regression can be used for prediction, estimation, hypothesis testing and many more things.
The linear regression line equation is written as: Y=a+bX where X is plotted along x−axis and is an independent variable and Y is plotted along y−axis which is a dependent variable.
Dependent variable means the variable we wish to predict and independent variable means the variable that is used to explain the dependent variable.
Linear regression shows the linear relationship between two variables.
Correlation analysis is used to measure strength of the association of linear relationships between two variables.
Correlation coefficient gives magnitude and direction of the relationship.
Correlation coefficient can vary between −1 to +1
Correlation is of two types:
POSITIVE CORRELATION
NEGATIVE CORRELATION
Positive Correlation:
If the value of r=′+′ then we can say that it is a positive correlation. In positive correlation both the variables change in the same direction.
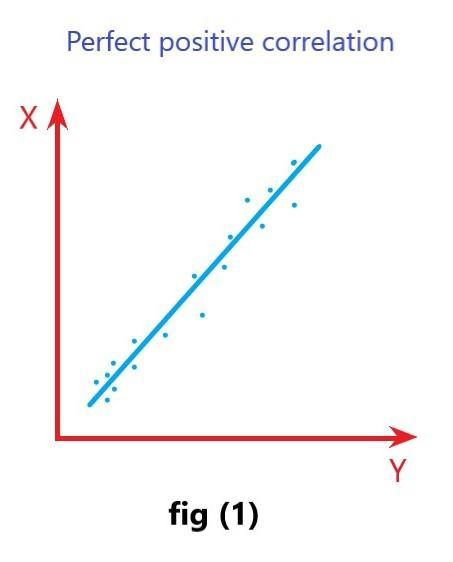
In fig (1) you can see that when x−axis is increasing then y−axis is also increasing.
Negative Correlation:
If the value of r=′−′ then we can say that it is a negative correlation. In negative correlation both the variables change in opposite directions.
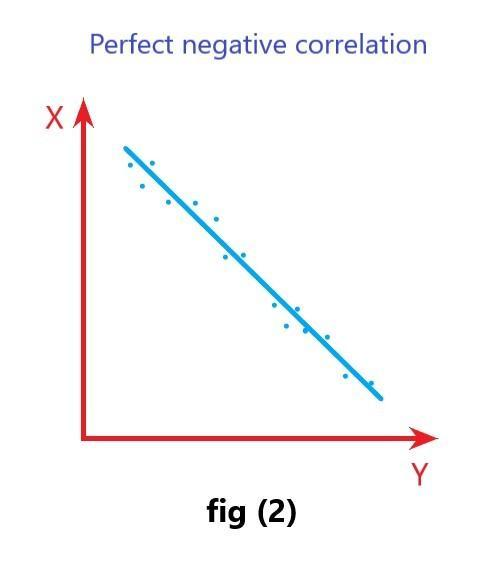
In fig (2) you can see the perfect negative correlation that has minimum value.
Hence fig (1) shows the positive correlation along with x−axis and y−axis and the straight line shows that y=x hence option (2) is correct.
Note: Students must know that the regression coefficient is the slope of the regression line which is equal to the average change in the dependent variable for a unit change in the independent variable. The strength of linear relationship increases as r moves away from 0