Question
Question: The plots between P and V which represent isochoric and isobaric process respectively: <img src="ht...
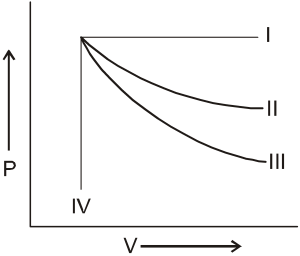
The plots between P and V which represent isochoric and isobaric process respectively:
A
I, II
B
IV, I
C
I, IV
D
II, III
Answer
IV, I
Explanation
Solution
For IV volume is constant (isochoric)
For I pressure is constant (isobaric)