Question
Question: The plot that depicts the behavior of the mean free time \(\tau \) (Time between two successive coll...
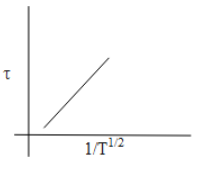
The plot that depicts the behavior of the mean free time τ (Time between two successive collisions) for the molecules of an ideal gas as a function of temperature (T). Qualitatively, is: (Graphs are schematic and not drawn to scale)
A. 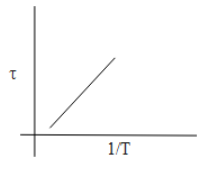
B. 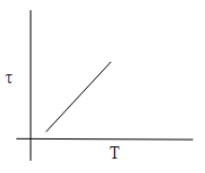
C. 
D. 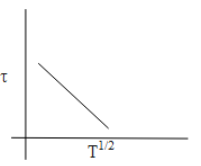
Solution
The mean free time of a molecule is the average time between the collisions of successive collisions. For collision, the molecule has to cover a certain distance that is named as a mean free path. Materials in different states (solid, liquid, and gas) have different mean free path values
Complete step by step solution:
The mean free time of molecules is given by the ratio of the mean free path and average speed of the molecule. The mean free path of the molecule is the distance between the two molecules and the average speed is the ratio of the distance and time in which the molecule can cover that distance.
Mathematically,
τ=2πd2nvTn....(1)
This can also be written as,
τ=Tk
So, if we consider T1 as x and τ as y. The above equation can be as,
y=kx
This is an equation of a straight.
From equation (1) we can say that the mean free time is directly proportional to T1 .
τ∝T1
So as the value of T1 increases the mean free time will also increase.
When we plot a graph of mean free time concerning the change in temperature will be as follows,
Thus, from the above discussion, we can say that the option which shows the correct graphical representation of mean free time concerning the increase in temperature is Option C.
Note:
The mean free path of the molecule is calculated by the product of mean free time and the average speed of the molecule. This concept is used for the study of the kinetic theory of gases to find coefficients such as velocity. In the case of gases, the mean free path of the can be quite large as compared to the liquid, and thus the mean free time can also be large.