Question
Question: The plot of the x component of the electric field as a function of x in a certain region is shown in...
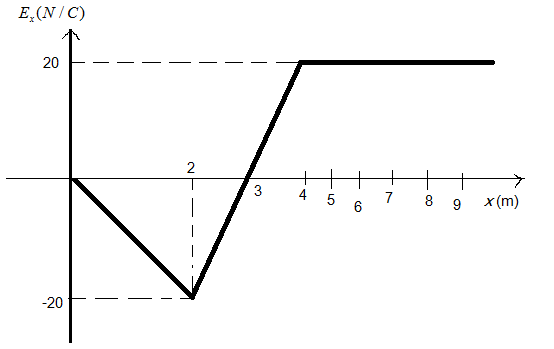
The plot of the x component of the electric field as a function of x in a certain region is shown in the figure. The y and z components of the electric field are zero in this region. The electrical potential at origin is 10V. The electric potential at x=2 is
A. 10V
B. 20V
C. 30V
D. 40V
Solution
In this question initially a particle is at rest with a potential energy of 10V, now the particle is moved from the rest to the positionx=2, then find the potential energy of the particle at x=2by using the area under the curve. For this, we need to find the area under the curve for the change in electric potential from origin tox=2.
Complete step by step answer:
Since the y and z components of the electric field are zero hence, we can say the initial position of the particle is at x=0where the electric potential is 10V,
Now the particle is being moved along the x-axis to the position x=2as shown in the plot and also the potential energy changes.
In the given Ex−xcurve, when the particle moves from position x=0tox=2, the potential curve moves in a negative direction hence we can write
Hence the electric potential of the particle at x=2will be =30V
So, the correct answer is “Option C”.
Note:
Electric potential is the amount of work needed to move a unit of electric energy from a reference point to a specific point in the electric field without acceleration being produced. Students must note that the potential difference between two points represents the work done in transferring a unit quantity from one point to the other.