Question
Question: The pie chart shows the percentage of individuals in different age groups that have met fatal road a...
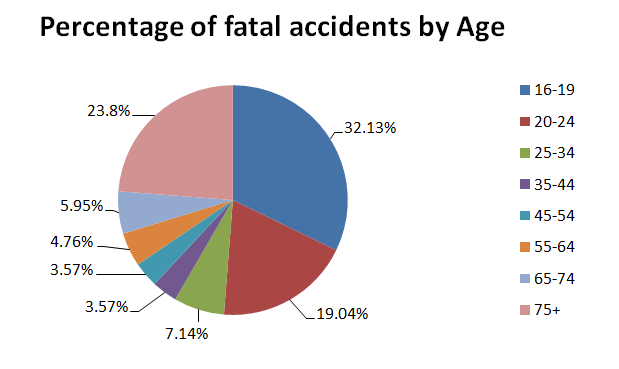
The pie chart shows the percentage of individuals in different age groups that have met fatal road accidents. What do you think according to the given data is the safest age group to drive?
(A)35−54
(B)16−19
(C)65−74
(D)25−34
Solution
Here, we have to find out the person who was to drive in the safest age group.
So we have to check the option one by one. Then we get the percentage of each option.
Finally we conclude the required answer.
Complete step-by-step solution:
Looking through the pie chart and relating the given information with respective of different colours, we get the following information:
According to Option (A),
The percentage of fatal accidents met by the age group 35−54 = 3.57%+3.57% = 7.14%
According to Option (B),
The percentage of fatal accidents met by the age group 16−19=32.13%
According to Option (C),
The percentage of fatal accidents met by the age group 65−74= 5.95%
According to Option (D),
The percentage of fatal accidents met by the age group 25−34= 7.14%
So among the given options the age group of 65−74 has the least number of accidents.
Age groups of 35−44 and 45−54 have the least percent individually. But when we compare both those groups as a single unit the accident percentage is more.
Therefore, the correct answer is (C)
Note: In these types of questions, don’t panic by seeing the size of the questions. We can find the solution by just looking through the question completely.
Compare the given options with the other options. Here, the question is to find the safest age group to drive. So, we should look for the least percentage of accidents that meet the age group.
Here, if the question is given as “Which is the most dangerous age group to drive?” then the answer would be the age group of 16−19 which holds the maximum percentages of fatal accidents. (i.e.) 32.13%