Question
Question: The \(P-T\) diagram for an ideal gas is shown in the figure, where \(AC\) is an adiabatic process. T...
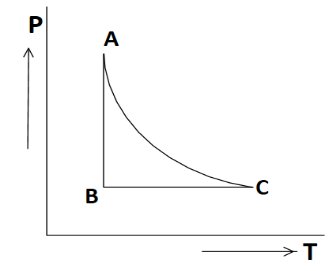
The P−T diagram for an ideal gas is shown in the figure, where AC is an adiabatic process. The corresponding PV diagram is
Solution
In this question we are asked to plot P-V diagram from the given P-T diagram, in which we will initially resolve the graph by finding all the process given in P-T diagram like we are already given with one process which is AC as adiabatic process. Similarly, we need to find the process AB and BC corresponding to the P-T diagram and at last we need to plot all three processes in the PV diagram.
Complete answer:
As we are given a P-T diagram with some process plotted in it and we are asked to plot all these processes in the P-V diagram. So as discussed we will start with defining each process in P-T diagram where we are given process AC as adiabatic process where adiabatic process shows that heat transfer doesn’t take place (ΔQ=0).
Now if we talk about the BC process which is parallel to the temperature axis and there is no increment of BC on the pressure axis which shows pressure in the BC process is constant, so the name of this process will be isobaric process.Similarly, process AB which is parallel to the pressure axis and there is no increment of AB on the temperature axis, which shows temperature in the AB process is constant, so the name of this process will be isothermal process.
Now as we got all three processes, we need to plot it on a P-V diagram, where on Y-axis pressure will be plotted and on X-axis volume. As we found BC process as isobaric process which means pressure in this will remains constant so it will be plotted parallel to volume axis. Now question arises for AB and AC process, because both process in P–V diagram represent as curve shape, so to find which one to plot outer side and which one on inner side we will use this equation,
ΔW=ΔQ−ΔU……………(1)
We know the area under P-V diagram gives work done.
Now for adiabatic process where ΔQ=0, equation (1) will be,
ΔWa=−ΔU
Where in isothermal process equation will be similar like equation (1),
ΔWi=ΔQ−ΔU,
From here we will conclude ΔWi>ΔWa which means area under isothermal process will be more than adiabatic process, which we can see by below given graph,
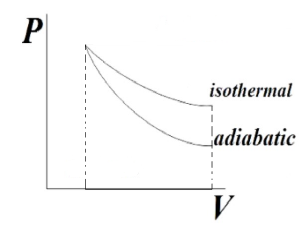
Which shows that adiabatic curve is steeper than isothermal process,
So after all our results the final P-V diagram will be as given below,
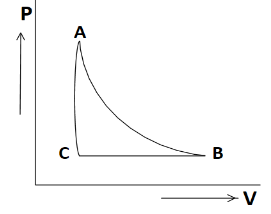
So the P-V diagram shown above will be our final answer.
Note: In this of question we usually confused to make difference between the adiabatic and isothermal curve in the P-V diagram, which can easily be identified by analyzing which curve is steeper and it will be considered as adiabatic curve and another method is to check area under the curve which will more area will considered as isothermal while other as adiabatic, note this method will be only applicable to P-V diagram.