Question
Question: The P-T and V-T diagrams of an isochoric process of \(n\) moles of an ideal gas from pressure \({P_0...
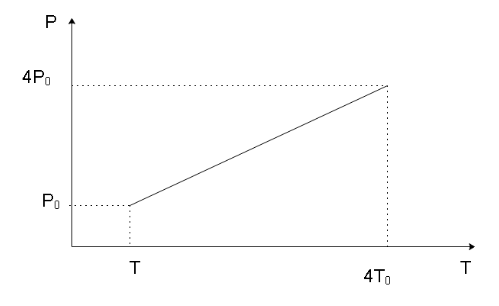
The P-T and V-T diagrams of an isochoric process of n moles of an ideal gas from pressure P0, volume V0 to pressure 4P0, indicating the pressures and temperatures of the gas in the initial and the final states will be __________.
Solution
Hint : In an isochoric process, the volume of the system remains constant while the system undergoes the process. Using the ideal gas law we can relate the pressure, volume, and temperature of an ideal gas in the initial and the final states of the gas.
Formula used: In this question, we will use the following formula:
PV=nRTwhere P is the pressure of the gas, V is the volume, n is the number of moles, R is the gas constant, and T is the temperature of the gas
Complete step by step answer
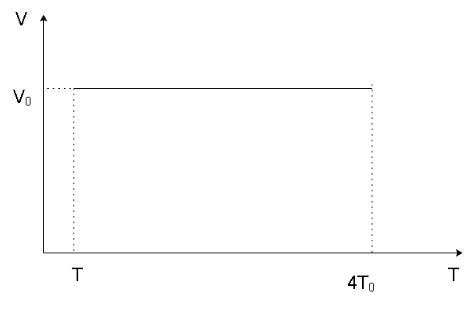
We’ve been given an isochoric process of n moles of an ideal gas from pressure P0, volume V0 to pressure 4P0. Since the process is isochoric, the volume of the process remains constant and we can say that the volume of the gas in the final state will also be V0.
Using the ideal gas law, we can write
PV=nRT
⇒V=PnRT
Since the volume of the gas remains constant, we can write
P1T1=P2T2
P0T1=4P0T2
Cross multiplying the numerator and denominator, we get
4T1=T2
We can now form the P-T and V-T diagrams knowing the initial and final stage of the gas as shown below
Note
Since the process is isochoric, we can get a hint that in the P-V graph, the line indicating the process will be parallel to the y -axis. Similarly, in the V-T graph, the line indicating the process will be parallel to the x -axis which can also be stated as the process line will be in a direction perpendicular to the direction of the volume axis as the volume of the system remains constant in the process and will have a singular value.