Question
Question: The number of students in a hostel, speaking different languages is given below: Display the data ...
The number of students in a hostel, speaking different languages is given below:
Display the data in a pie chart:
| Language | Hindi | English | Marathi | Tamil | Bengali | Total |
|---|---|---|---|---|---|---|
| Number of students | 40 | 12 | 9 | 7 | 4 | 72 |
Solution
Here representing the given data in a graphical way, or presenting it graphically which is called as the graphical representation, which refers to visually displaying and analyzing with the use of charts and graphs, which is also used to interpret numerical data. Here using a pie chart which is also called a circle graph, as it is a circular statistical graph, which is divided into pies (called slices) to illustrate the numerical proportion of the data.
Complete step-by-step solution:
Here in the problem given the data of the students who speak their respective language.
Given that how many students speak a particular language in the hostel.
⇒No. of students that speak hindi = 40
⇒No. of students that speak english = 12
⇒No. of students that speak marathi = 9
⇒No. of students that speak tamil = 7
⇒No. of students that speak bengali = 4
Given that the total no. of students = 72
Now calculating the percentage of Hindi speaking people:
As the no. of students that speak Hindi = 40
The total no. of students = 72
⇒7240×100=0.555
⇒55.5%≈56%
∴The percentage of Hindi speaking students = 56%
The percentage of English speaking students:
⇒7212×100=0.166
⇒16.6%≈17%
∴The percentage of Hindi speaking students = 17%
The percentage of Marathi speaking students:
⇒729×100=0.125
⇒12.5%≈12%
∴The percentage of Marathi speaking students = 12%
The percentage of Tamil speaking students:
⇒727×100=0.097
⇒9.72%≈10%
∴The percentage of Tamil speaking students = 10%
The percentage of Bengali speaking students:
⇒724×100=0.055
⇒5.55%≈5%
∴The percentage of Bengali speaking students = 5%
∴The pie chart can be made according to the percentages as:
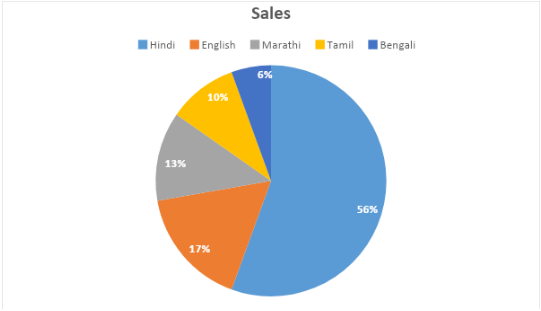
Note: The data can be represented in any graphical format but pie charts are the best for displaying data for around 6 categories or lower. Pie chart is a structural graph which is divided into many parts and each part representing the amount of proportion of an item from the entire proportion.