Question
Question: The number of integral values of ‘a’ so that \[f\left( x \right)=\mid \left| \left| \left| x \right|...
The number of integral values of ‘a’ so that f(x)=∣∣∣∣x∣−2∣+a∣has exactly 7 point of non-differentiability ∀x∈R is
Solution
To find if any function is non-differentiable or has non-differentiable points is if the graph of that function has or has any sharp curves or bends or any gap between the lines forming the graph. Here we find the graph of the function f(x)=∣∣∣∣x∣−2∣∣ and then we will check how many sharp bends it has and after that we will add ‘a’ to the function and again check the graph to find which value of ‘a’ will give us seven non-differentiable points.
Complete step by step solution:
Now to find the point of non-differentiability, we will use the graphical method where we will find the graph of the equation f(x)=∣∣∣∣x∣−2∣+a∣, now the value of ‘a’ is a constant moving the graph along the y-axis and to prove that we will only draw a graph of f(x)=∣∣∣∣x∣−2∣∣ as shown below:
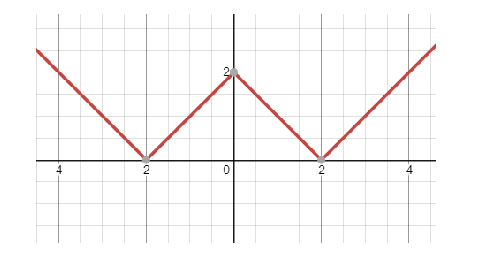
Here we can see that the graph lies on the x-axis so if we add or subtract any constant in mod will always show the graph above x-axis. Now to find the values of ‘a’.
From the graph we can see that the graph is positive hence, the value of ∣∣∣x∣−2∣+a∣>0 . For ‘a’ we take the value of ‘a’ from (0,2).
For x=0, f(x)=∣∣∣∣x∣−2∣+a∣ we have:
⇒∣∣−2∣+a∣>0,x→0
⇒∣a∣>2
Now placing the value of ‘a’ in the equation we get the graph as:
f(x)=∣∣∣∣x∣−2∣+2∣
For x=1, f(x)=∣∣∣∣x∣−2∣+a∣ we have:
⇒∣1∣−2∣+a∣<0,x→0
⇒∣a∣>−1
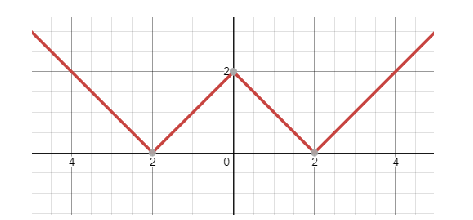
Now placing the value of ‘a’ in the equation we get the graph as:
f(x)=∣∣∣∣x∣−2∣+1∣
For x=2, f(x)=∣∣∣∣x∣−2∣+a∣ we have:
⇒∣2∣−2∣+a∣>0,x→0
⇒∣a∣>0
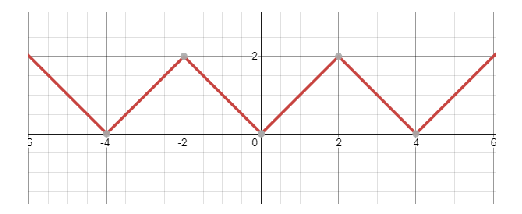
Now placing the value of ‘a’ in the equation we get the graph as:
f(x)=∣∣∣∣x∣−2∣∣
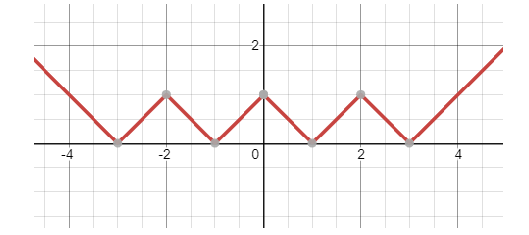
By seeing the diagrams, we can see that for ‘a’ the value that gives the 7 non-differentiable points is when a=−1.
Note: The graphical method in this question may look long and hectic but it is the most easily formed method to find the value of ‘a’ and the triangle tips are the point of non-differentiability. Now the value of ‘a’ should have been positive as the graph lies above the x-axis but due to the mod function, the graph has folded upwards which means if we remove the mod function the real value of ‘a’ should be negative.