Question
Question: The monthly income of a family is Rs.28000.the monthly expenditure of the family on various items is...
The monthly income of a family is Rs.28000.the monthly expenditure of the family on various items is given below.
| ITEM | RENT | FOOD | CLOTHING | EDUCATION | SAVING |
|---|---|---|---|---|---|
| EXPENDITURE (IN Rs.) | 8000 | 10800 | 5600 | 3600 | 800 |
Represent the above data by a pie chart.
Solution
We know that a pie chart is nothing but a circle which is divided in different parts according to the various items or objects in the question. So we will find the value of each item in degrees and will allot that much portion of pie chart to it. Let’s start!
Complete step by step solution:
Here we are given 5 different items on which a family spends some amount on a monthly basis . It also involves their saving. The monthly income of the family is Rs. 28000
We have to divide a full circle of 360∘ in these 5 parts depending upon the value of rs. In degrees.so let’s find it out.
Here monthly income is equal to whole circle that is 360∘
And then in order to find the value of the remaining parts we will use our ever useful unitary method!
So, if
This will be the pattern for all items. So instead of writing them in line let’s tabulate them!
| ITEM | AMOUNT IN Rs. | DEGREES IN PIE CHART |
|---|---|---|
| 1.RENT | Rs.8000 | 28800360×8000=288360×80=100∘ |
| 2. FOOD | Rs.10800 | 28800360×10800=801×10800=135∘ |
| 3.CLOTHING | Rs.5600 | 28800360×5600=801×5600=70∘ |
| 4.EDUCATION | Rs.3600 | 28800360×3600=801×3600=45∘ |
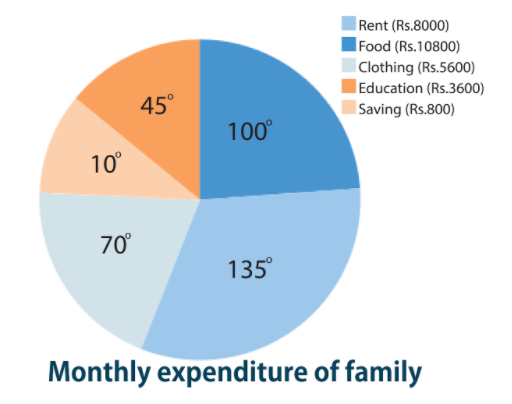
| 5.SAVING | Rs.800 | 28800360×800=801×800=10∘ |
Now since we have values of all items in degrees let’s get the pie chart done. Very first using a protractor divide the regions in the respective degrees. And then either give name on each section or part or on the right side of the pie chart note the information with different colours and the quantity in which they are given originally like as shown below. Always remember to give a suitable name to your pie chart.
Note:
Here in this problem with calculations if you observe the table of degrees in pie chart I have calculated a fixed ratio of 28800360=801. So it helps to make calculations easy. Students try to minimize as many fractions to the simplest form as possible.