Question
Question: The Maxwell-Boltzmann distribution law of molecular speeds of graphically represented as: This cu...
The Maxwell-Boltzmann distribution law of molecular speeds of graphically represented as:
This curve has which of the following characteristics?
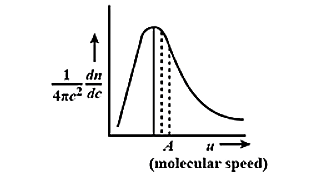
(A) It has symmetrical distribution.
(B) The point A on x-axis represents the most probable speed
(C) The area under the curve gives the total number of molecules
(D) The maximum shifts to the right as the temperature increases.
Solution
The motion of molecules is extremely chaotic. One individual molecule will be colliding with another molecule at an enormous rate. The rate of the collision is a billion times per second.
Complete Solution :
Let us see what a Boltzmann distribution law is.
The motion of molecules is extremely chaotic. One individual molecule will be colliding with another molecule at an enormous rate. The rate of the collision is a billion times per second. Let us introduce the term nv(E) which is the number density. This is also known as the distribution function. dEis the number of molecules that are present per unit volume whose energy is between E and E+dE.
Based on the statistical mechanics, we can give :
nv(E)=n0ekBT−E
According to the Boltzmann Law, the probability of finding a molecule at a particular energy state will vary exponentially as the energy divided by kBT.
Where kBT is the Boltzmann constant.
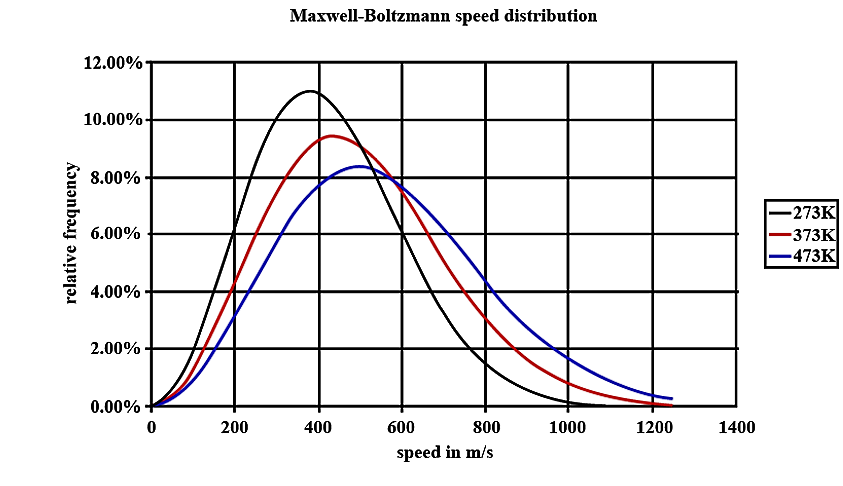
- In the graph given below there are three lines. These lines are drawn for the same number of particles but for different temperatures. For now, concentrate on the one marked 273 K. You should notice that there are some of the particles with low speeds, few with high speeds and many with medium speeds. The area that is present below the line will give the total number of particles in the gas. Now look at the 373K line, the total number of particles is the same so the total area under the line is the same, but more particles have faster speeds. The line has to move lower as the area underneath it can't change.
- We have to notice that at a very high speed, the area under the line will be very dependent on the temperature. For most reactions, the number of these molecules increases very rapidly as the temperature is raised. When there is a small increase in temperature, it can cause a larger increase of the number of particles present.
Therefore, the correct answer is option (B) The point A on x-axis represents the most probable speed and (C) The area under the curve gives the total number of molecules
So, the correct answer is “Option B”.
Note: The speed that is possessed by any type of molecule in the system corresponds to the maximum value or mode of f(v), that speed is the most probable speed. The distribution does not reflect any symmetricity.