Question
Question: The mass density of a spherical body is given by \(\rho \left( r \right)=\dfrac{k}{r}\) for \(r\le R...
The mass density of a spherical body is given by ρ(r)=rk for r≤R and ρ(r)=0 forr⟩R, where r is the distance from the centre. The correct graph that describes qualitatively the acceleration a of a test particle as function of r is:
A.
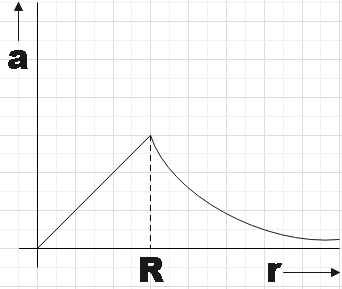
B.
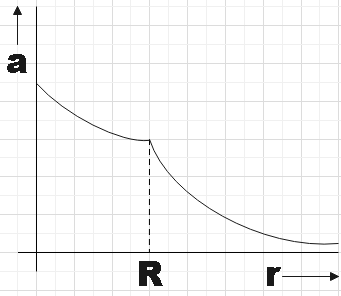
C.
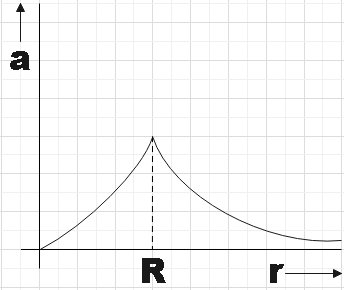
D.
Solution
You could first read the question and thus understand the situation properly. You could maybe find some relation that gives the dependency of acceleration of a test particle with distance as these are two parameters of which we are supposed to make a plot. Otherwise you could do it for parameters that have direct dependency on acceleration.
Formula used:
Electric force,
F=qE
Ampere’s circuital law,
∫E.dA=ε0Q
Complete answer:
We know that the electrostatic force could be given by,
F=qE
⇒ma=qE
So we could say that for a test particle of mass m and charge q, its acceleration would be directly proportional to electric field. That is,
aαE ………………………………………….. (1)
Now we could check the dependency of the electric field with distance r from the given conditions.
For r≤R the mass density is given as,
ρ(r)=rk
So we could say that charge contained within a sphere of radius r would be,
Q=∫rkdr×4πr2=4kπ(2r2)=2kπr2 ………………………………………… (2)
From ampere’s circuital we know that,
∫E.dA=ε0Q
⇒E(4πr2)=ε0Q
From (2),
E=4πε0r22kπr2=2ε0k ……………………………………. (3)
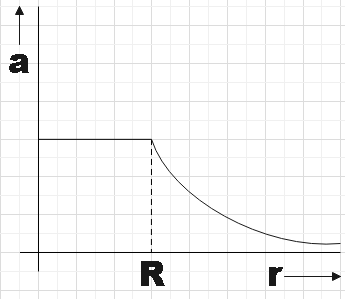
Therefore, we found that the electric field doesn’t depend on distance r and would be constant for r≤R and so will be the acceleration of the test particle.
For r≥R, there is no dependency of mass density with distance, so,
E=r2kQ
So, we see that there is an inverse square dependence of the electric field with distance and so will the acceleration. So, we could say that if plot acceleration against distance the plot would look like the one in option A.
So option A is the correct answer.
Note: In questions like these where we are supposed to make a plot, we should take off the intervals that are taken into consideration. For example, here we have two intervals: one that is 0 to R and the region that is beyond R. We are also given necessary points for making the plot for the respective regions to make it easier.