Question
Question: The marks obtained by 200 students in an examination are given below. Marks| 0–10 | 10–20| 20–30...
The marks obtained by 200 students in an examination are given below.
| Marks | 0–10 | 10–20 | 20–30 | 30–40 | 40–50 | 50–60 | 60–70 | 70–80 | 80–90 | 90–100 |
|---|---|---|---|---|---|---|---|---|---|---|
| No. of students | 5 | 10 | 11 | 20 | 27 | 38 | 40 | 29 | 14 | 6 |
Using a graph paper, draw an ogive for the above distribution. Use the ogive to estimate:
(a) the median.
(b) the number of students who obtained more than 80% marks in the examination.
(c) the number of students who did not pass if the pass percentage was 35.
Solution
Here, we need to draw an ogive and find the required data. First, we will convert the exclusive series into a less than type series using cumulative frequencies. Using the less than type series, and taking the age on x-axis and number of casualties on y-axis, we will plot the points and join them to get the required ogive. Finally, we will find the required data by drawing straight lines from the axes to the ogive.
Complete step by step solution:
The given table shows an exclusive series, not an inclusive series. Therefore, we do not need to convert it first.
We will create a less than ogive table, using cumulative frequencies.
We will convert the rest of the class intervals into less than type using cumulative frequencies.
| Marks | Less than 10 | Less than 20 | Less than 30 | Less than 40 | Less than 50 | Less than 60 | Less than 70 | Less than 80 | Less than 90 | Less than 100 |
|---|---|---|---|---|---|---|---|---|---|---|
| No. of students | 5 | 15 | 26 | 46 | 73 | 111 | 151 | 180 | 194 | 200 |
Finally, we will use the marks on x-axis and number of students on y-axis to draw the less than ogive.
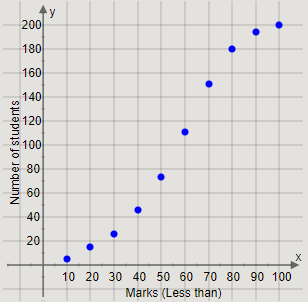
Plotting the points (10,5),(20,15),(30,26),(40,46),(50,73),(60,111),(70,151),(80,180),(90,194),(100,200), we get the graph
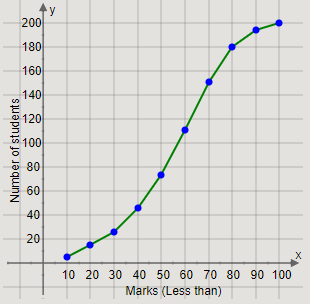
Joining the pairs of two successive points, we get the curve
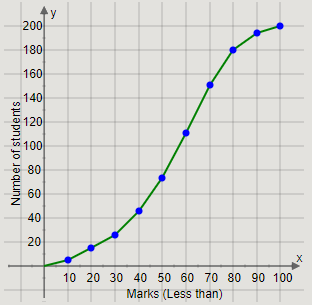
Joining the first point to the origin, we get the ogive as
(a)
We will find the median using the ogive.
The median is the (2N)th term.
The total number of students is 200.
Therefore, we get
2N=2200=100
From the point (0,100) on the ‘number of students’ axis, we will draw a straight line towards the ogive.
Then, from the point on the ogive, we will draw a straight line towards the ‘Marks’ axis.
The marks at which the straight line touches the ‘marks’ axis is the median marks.
Therefore, we get the graph
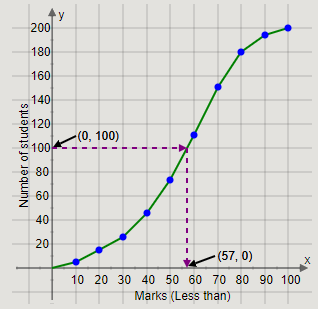
Thus, the median marks are approximately 57 marks.
(b)
Total marks are 100 marks.
The 80% of 100 marks is 80 marks.
The number of students who obtained more than 80 marks is the difference in the total number of students and the number of students less than 80 marks.
We will use the ogive to find the number of students less than 80 marks.
From the point (80,0) on the ‘marks’ axis, we will draw a straight line towards the ogive.
Then, from the point on the ogive, we will draw a straight line towards the ‘number of students’ axis.
The number of students at which the straight line touches the ‘number of students’ axis is the number of students who got less than 80 marks.
Therefore, we get the graph
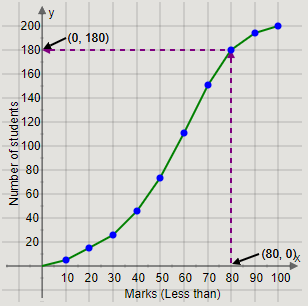
Thus, the number of students who obtained less than 80 marks is 180.
Therefore, we get
Number of students who obtained more than 80 marks =200−180=20
Thus, the number of students who obtained more than 80 percent marks is 20 students.
(c)
Total marks are 100 marks.
The 35% of 100 marks is 35 marks.
We will use the ogive to find the number of students who did not pass if the pass percentage was 35.
From the point (35,0) on the ‘marks’ axis, we will draw a straight line towards the ogive.
Then, from the point on the ogive, we will draw a straight line towards the ‘number of students’ axis.
The number of students at which the straight line touches the ‘number of students’ axis is the number of students who got less than 80 marks.
Therefore, we get the graph
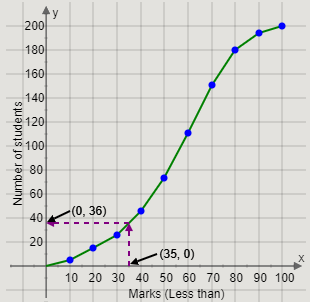
Thus, there are 36 students who obtained less than 35 percent.
Note:
We have used the terms ‘exclusive series’ and ‘inclusive series’ in the solution.
An inclusive series is that series where the class intervals include both upper and lower limits. For example: In the inclusive series, 10 – 19 includes all the numbers between 10 and 19, along with 10 and 19 also.
An exclusive series is that series where the class intervals include both upper and lower limits. We know that in an exclusive series, the upper limit of a class interval is equal to the lower limit of the next class interval. For example: In the exclusive series, 9.5 – 19.5 includes all the numbers between 9.5 and 19.5, including 9.5 but not 19.5.
It is important to convert an inclusive series into an exclusive series before making the less than or more than series.