Question
Question: The marks obtained by 100 students of a class in an examination are given below. Marks| \[0 - 5\...
The marks obtained by 100 students of a class in an examination are given below.
| Marks | 0−5 | 5−10 | 10−15 | 15−20 | 20−25 | 25−30 | 30−35 | 35−40 | 40−45 | 45−50 |
|---|---|---|---|---|---|---|---|---|---|---|
| No. of Students | 2 | 5 | 6 | 8 | 10 | 25 | 20 | 18 | 4 | 2 |
Draw a less than type Cumulative Frequency Curve (Ogive). Hence Find the Median.
Solution
In this question we will convert the frequency table to a cumulative frequency table and plot the graph and then draw its ogive, and hence find the median.
Complete step-by-step solution:
To draw an ogive we require the cumulative frequencies of the values
The distribution table can be written as:
| Marks | No. of Students |
|---|---|
| 0−5 | 2 |
| 5−10 | 5 |
| 10−15 | 6 |
| 15−20 | 8 |
| 20−25 | 10 |
| 25−30 | 25 |
| 30−35 | 20 |
| 35−40 | 18 |
| 40−45 | 4 |
| 45−50 | 2 |
Now to find the Cumulative frequencies in a less than type cumulative frequency we add all the preceding terms to the current term, Therefore the cumulative frequency table could be written as:
| Marks | No. of Students | Cumulative Frequency |
|---|---|---|
| 0−5 | 2 | 2 |
| 5−10 | 5 | 2+5 |
| 10−15 | 6 | 2+5+6 |
| 15−20 | 8 | 2+5+6+8 |
| 20−25 | 10 | 2+5+6+8+10 |
| 25−30 | 25 | 2+5+6+8+10+25 |
| 30−35 | 20 | 2+5+6+8+10+25+20 |
| 35−40 | 18 | 2+5+6+8+10+25+20+18 |
| 40−45 | 4 | 2+5+6+8+10+25+20+18+4 |
| 45−50 | 2 | 2+5+6+8+10+25+20+18+4+2 |
Upon simplifying the above table, we get:
| Marks | No. of Students | Cumulative Frequency |
|---|---|---|
| 0−5 | 2 | 2 |
| 5−10 | 5 | 7 |
| 10−15 | 6 | 13 |
| 15−20 | 8 | 21 |
| 20−25 | 10 | 31 |
| 25−30 | 25 | 56 |
| 30−35 | 20 | 76 |
| 35−40 | 18 | 94 |
| 40−45 | 4 | 98 |
| 45−50 | 2 | 100 |
Now, we have to plot the graph with taking the upper limit of Marks on X-axis and the respective cumulative frequency on the Y-axis to get the less than ogive.
The points to be plotted to make a less than ogive are on the graph are: (5,2),(10,7),(15,13),(20,21),(25,31),(30,56),(35,76),(40,94),(45,98),(50,100)

The Curve in the above graph is the Cumulative Frequency Curve i.e. The ogive.
Now to find the median:
Let N be the total number of students whose data is given.
Also N will be the cumulative frequency of the last interval.
We find the [2N]th item (student) and mark it on the y-axis.
In this case the [2N]th item (student) is (100/2)th = 50th student.
We draw a perpendicular from 50 to the right to cut the Ogive curve.
From where the Ogive curve is cut, draw a perpendicular on the x-axis. The point at which it touches the x-axis will be the median value of the series as shown in the graph:
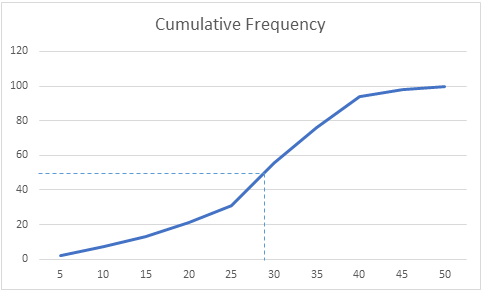
∴ From the above Graph we can see that the median is 29
Hence we get the required answer.
Note: The cumulative frequency should always be plotted on the Y-axis to get a correct ogive.
There also exists a more than ogive, in this type of ogive while making the cumulative frequency table, all the succeeding terms in the distribution should be added to a term in the table.