Question
Question: The marks obtained by 100 students in a Mathematics test are given below: Marks| No. of students...
The marks obtained by 100 students in a Mathematics test are given below:
| Marks | No. of students |
|---|---|
| 0−10 | 3 |
| 10−20 | 7 |
| 20−30 | 12 |
| 30−40 | 17 |
| 40−50 | 23 |
| 50−60 | 14 |
| 60−70 | 9 |
| 70−80 | 6 |
| 80−90 | 5 |
| 90−100 | 4 |
Draw an ogive for the given distribution on a graph sheet. Use the ogive to estimate the number of students who obtained more than 85% marks in the test.
(Use a scale of 2cm=10 units on both axes).
Solution
In this question, we have been asked to draw the ogive and then use it to find the number of students who obtained more than 85% marks in the test. To draw an ogive, first make a table of cumulative frequency and then mark it on the graph. Take marks on x-axis and cumulative frequency on y-axis and allot the points. This will make less than ogive. Then see the point corresponding to 85 of x-axis.
Complete step-by-step solution:
We are given the marks obtained by 100 students in a mathematics test and we have been asked to make an ogive. An ogive can either be drawn for less than ogive, and more than or greater than ogive.
Let us draw less than ogive. In this type of ogive, the frequencies of all the preceding class are added to the frequency of that class. Let us make a table of cumulative frequency.
| Marks | No. of students | Cumulative frequency |
|---|---|---|
| 0−10 | 3 | 3 |
| 10−20 | 7 | 3+7=10 |
| 20−30 | 12 | 10+12=22 |
| 30−40 | 17 | 22+17=39 |
| 40−50 | 23 | 39+23=62 |
| 50−60 | 14 | 62+14=76 |
| 60−70 | 9 | 76+9=85 |
| 70−80 | 6 | 85+6=91 |
| 80−90 | 5 | 91+5=96 |
| 90−100 | 4 | 96+4=100 |
Now, we have been told that we have to use the scale of 2cm=10units.
Let us mark the points on the graph.
On x-axis, we will take marks and on y-axis, we will take cumulative frequency. So, the points to be marked are- (10,3),(20,10),(30,22),(40,39),(50,62),(60,76),(70,85),(80,91),(90,96),(100,100).
Plotting them on the graph,
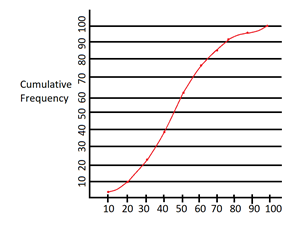
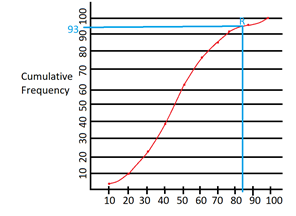
This is the one of the given distributions. It is basically the graphical representation of cumulative frequency. Now, let us use the ogive to estimate the number of students who scored more than 85%. For this, we will draw a vertical line passing through 85 on the x-axis (because marks are shown on x-axis). Then, we will mark the intersection of the vertical line and ogive as point R. Then we will draw a horizontal line passing through point R and see where it intersects on the y-axis.
As we can see, the horizontal line intersects the y-axis at 93. Therefore, 93 students scored less than 85%.
Number of students scoring more than 85% are 100−93=7.
Note: The points are only plotted on the upper limit of the class interval and not on lower limit.
The points are only plotted on the upper limit of the class interval and not on lower limits. It means that we took the upper limits as abscissa.