Question
Question: The graphs below show the force \[F\] acting on identical objects as a function of the distance \[d\...
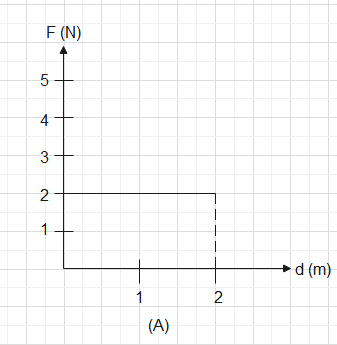
The graphs below show the force F acting on identical objects as a function of the distance d that the objects move. In all cases, the force and the direction of motion are along the same straight line. In which case does the force do the greatest amount of work during the interval between d=0 to d=2$$$$m?
Solution
When attempting questions based on the F−s graph keep in mind that the area covered by the graph gives us the work done on the object by the force F and the distance d caused by the said force in order to move the object the required distance d in the given time.
Complete answer:
\Rightarrow $$$$(dw)=F.(ds)
⇒∫dw=∫F.ds
⇒w=∫F.(ds) Which is also equal to the Area under F−s graph.
So in order to find the graph which has the maximum amount of work done by the force in the interval of d=0 to d=2$$$$m we need to find the area under the given F−s graph. The graph which has the maximum area under the graph will have the maximum amount of work and hence will be our answer.
Now let’s take out the areas under the various graphs given to us.
In graph (A) the figure we have is a rectangle so we have the area coming up to be
2×2 units which is 4unit2
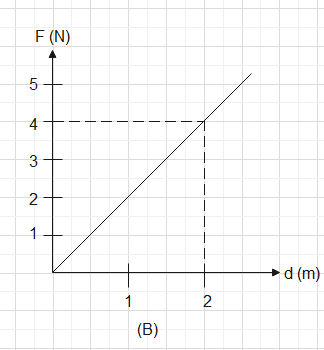
In graph (B) the figure is of a triangle so the area under the graph will be
21×4×2 units which will also come out to be 4unit2
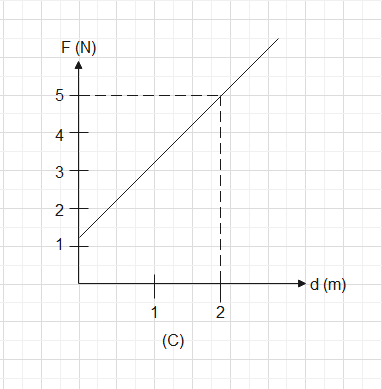
In graph (C) the area under the graph will be
21×2(5+1) units which comes out to be 6unit2
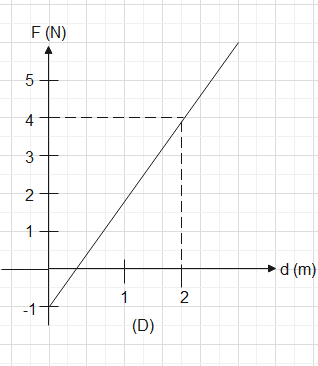
In graph (D) we also get a figure similar to triangle so the area under the given graph will come out to be
21×4×1.5 units where in the answer comes out to be 3unit2
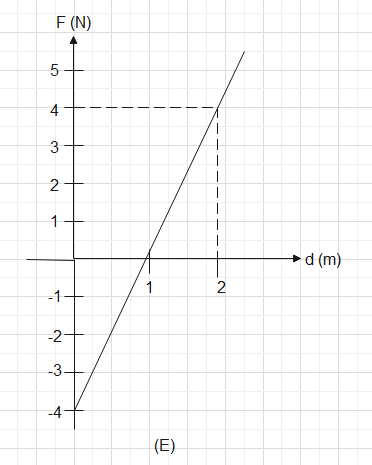
In graph (E) if we see closely we see that the graph above the x−axis is the same as below it. The values of the graph covered above are the same above and below the x−axis. Which means that the area under graph (E) comes out to be 0unit2.
So now from all the calculations we know graph (C) has the maximum area covered in its graph so we can conclude by saying that in Graph (C) force does the maximum work.
Hence, graph (C) is the correct answer.
Note: Area under the F−s graph gives us the value of Work which is equal to the kinetic or potential energy the object gains due to the application of the force in a given direction which enables it to gain some distance as well. Since we know Work is a dot product of force and displacement, it is a scalar quantity.