Question
Quantitative Ability and Data Interpretation Question on Bar Graph
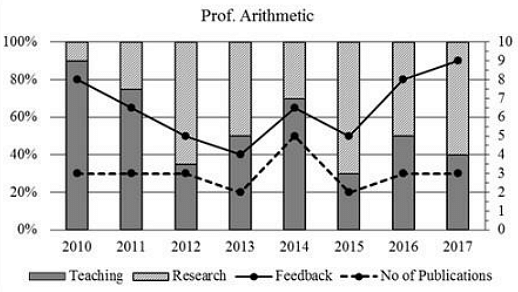
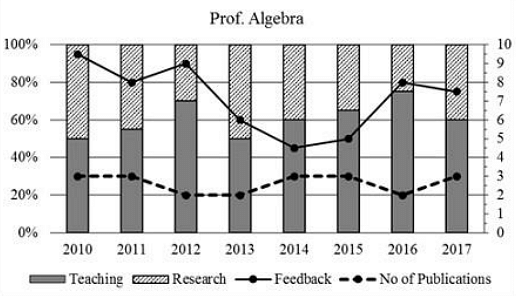
The graphs below represent the performance of four professors, across years, measured on four variables: Percentage of time spent on teaching, percentage of time spent on research, feedback (on a scale of 10, right-hand side) and number of publications (right-hand side). Assume that the cumulative time spent per year on research and teaching activities are same for all four professors and each of them taught only one course of 90 classroom hours.