Question
Question: The graphs at constant pressure are called isobars. A. True B. False...
The graphs at constant pressure are called isobars.
A. True
B. False
Solution
In thermodynamics, the state of a system is defined by various thermodynamic variables such as pressure, volume, Temperature, Number of moles of any substance and various relations are studied between these properties. We will discuss the graphing of these parameters and their names as used in Thermodynamics.
Complete answer:
When various graphs are drawn between thermodynamic parameters. For example, there can be various graphs between pressure and volume of a system but let us draw the state when pressure is being constant and also a graph where volume remains constant as shown in the diagram.
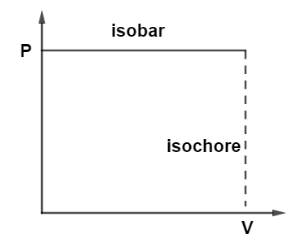
So, when pressure is kept constant on vertical Y axis then it will be a straight line parallel to horizontal X axis and these straight lines on PV diagram whenever pressure is kept constant these lines are known as isobars whereas, if we draw a graph where volume at horizontal X axis kept constant then it will be a straight line parallel to vertical axis and this line is known as Isochore. at constant volume of the system. So, the graphs drawn at constant pressure are known as Isobars.
Hence, the correct option is A.
Note: It should be remembered that, not only on the PV diagrams we can draw on any relationship like pressure versus temperature, pressure versus number of moles of the system but basic line is the graph lines which are drawn at constant pressure irrespective of other variable, these graphs are called Isobars and also the graphs which are drawn at constant volume is called Isotherms.