Question
Question: The graph which depicts the results of Rutherford gold foil experiment with α-particles is: \(\th...
The graph which depicts the results of Rutherford gold foil experiment with α-particles is:
θ : Scattering angle
Y : Number of scattered α-particles detected
(Plots are schematic and not to scale)
A) 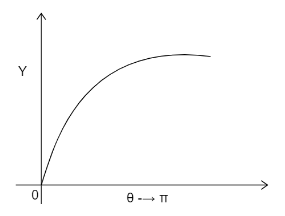
B) 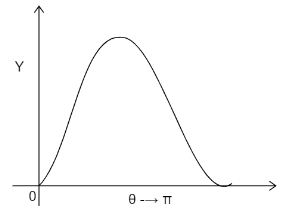
C) 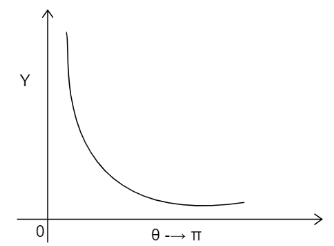
D) 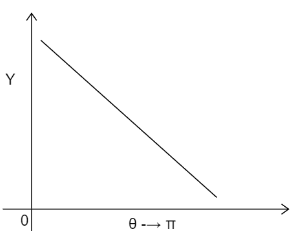
Solution
The given question can be solved by knowing the concepts of Rutherford's atomic experiments which gives us the scattering formula. This formula tells us that the no. of particles scattered are inversely proportional to the scattering angle.
Complete answer:
Hans Geiger and Ernest Marsden in 1909 performed the experiment in collaboration with Rutherford. The formula used in this question will be: N(θ)=sin4(4θ)K
Where N(θ)= no. of alpha particles scattered through an angle θ and K is the constant. Ernest Rutherford in his alpha scattering particle experiment shot a beam of alpha particles on a thin gold foil. Majority of the alpha particles passed through the sheet without any deflection, while some of the particles get deflected by a small angle and even large angles. From the scattering formula we know that: N(θ)∝sin4(4θ)1
Where N(θ)= no. of alpha particles scattered through an angle θ
When 4θ=2π→θ=2π
Therefore from 0 to 2π sin4(4θ) increases. Therefore 1/sin4(4θ) decreases. At θ=0,sin0=0, therefore 1/sin4(4θ)→∞
The graph will decrease exponentially and will run parallel to the x axis without touching it. The graph obtained will be:
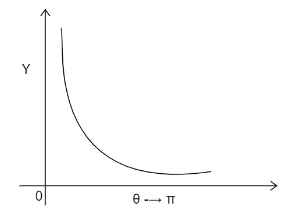
The correct answer id Option C).
Note:
The Rutherford gold foil experiment led to the discovery of the nucleus. Rutherford’s experiment concluded that there is a positively charged particle, which causes the alpha rays to deflect, at the centre surrounded by hollow space. This positively charged space was later known as the nucleus. Many structures of an atom were published after the discovery of the nucleus. The latest atom model we study was given by Bohr.