Question
Question: The graph represents the velocity time or the first \(4\) second of the motion. Find the distance co...
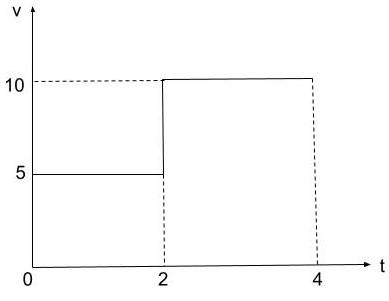
The graph represents the velocity time or the first 4 second of the motion. Find the distance covered.
Solution
An area covered, often known as an area graph, is a graphical representation of quantitative data. A velocity-time graph depicts the speed and direction of an object over a certain time period. Speed-time graphs are sometimes known as velocity-time graphs. The velocity of the item is the vertical axis of a velocity-time graph. The time from the beginning is represented on the horizontal axis.
Complete step by step solution:
We can solve this problem by using Area under the graph.
So, from the graph we can see that the graph is divided into two parts. The first part is from 0 to 2 and the second part is 2 to 4.
So let us first calculate the area under the graph from 0 to 2.
Area under the rectangle = length ×breadth.
=2×5=10
Now, Let us calculate the area under the graph from 2 to 4.
Area under the rectangle = length ×breadth.
=10×(4−2)=20
Now, by adding both the area we can calculate the distance covered =10+20=30m
So, the total distance covered is 30m.
Note:
The velocity is changing linearly, showing that the velocity is changing at a constant rate or there is constant acceleration, as seen in the graph above for a uniformly accelerated motion. In uniformly accelerating motion, however, the velocity time graph would be a straight line since velocity varies at a consistent rate with respect to time with acceleration.