Question
Question: The graph of the sine function lies exactly in which of the following region? A) \[y = - 1{\text{ ...
The graph of the sine function lies exactly in which of the following region?
A) y=−1 to y=1
B) y=−∞ to y=∞
C) y=1 to y=∞
D) y=−∞ to y=−1
Solution
Hint : To find the region in which graph of sine function lies exactly we will draw a graph by plotting various sine angles. From there, the maximum and minimum values on the y – axis will be the region or range of the sine function.
Trigonometric formulas:
sin(90+θ)=cosθ
sin(180+θ)=−sinθ
Complete step by step solution:
The value of different angles of sine is given as:
sin 0° = 0
sin 90° = 1
sin 180° = sin (90 + 90°)
= cos 90° [∵sin(90+θ)=cosθ]
= 0
sin 270° = sin (180 + 90°)
= sin 90° [∵sin(180+θ)=−sinθ]
= -1
sin 360° = sin (180 + 180°)
= sin 180°
= 0
To get a graph for sine function we can plot the values of certain angles on the graph. The table for values of sine can be drawn as:
| Angles | Measure |
|---|---|
| sin 0° | 0 |
| sin 90° →[sin(2π)] | 1 |
| sin 180° →[sin(π)] | 0 |
| sin 270° →[sin(23π)] | -1 |
| sin 360° →[sin(2π)] | 0 |
Plotting these values on graph we get:
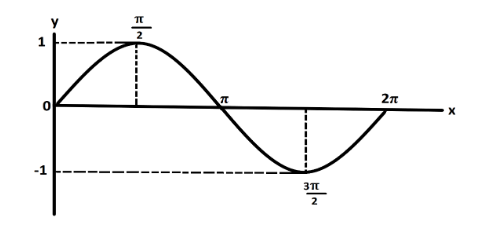
From the graph, it can be seen that the minimum value at y –axis is -1 and the maximum value is 1. So, the graph of sine function will lie between the range y=−1 to y=1.
So, the correct answer is “Option A”.
Note : We take the sine angle greater than 180° with a negative sign because the value does not lie in the second quadrant and the sine function is positive only in the second quadrant where values lie between 90° to 180° .
We know that the value of sine function lies between the interval -1 to 1 and represented as:
−1⩽sinx⩽1
So, we could have written the range along y- axis directly