Question
Question: The graph of the hyperbolic tangent function for all real values is: A. Strictly increasing B. S...
The graph of the hyperbolic tangent function for all real values is:
A. Strictly increasing
B. Strictly decreasing
C. Strictly increasing in the interval [0,∞) and Strictly decreasing in the interval (-∞,0]
D. Strictly increasing in the interval (-∞,0] and Strictly decreasing in the interval [0,∞)
Solution
The hyperbolic tangent function,that is, tanh function is the ratio of sinh function to the cosh function. We can find the trend of the graph by giving different values of x and observing the corresponding trend in y value.
Complete step by step answer:
The tanh function or hyperbolic tangent function is the ratio between hyperbolic sine and hyperbolic cosine.
We know that,
sinhx = 2ex - e - x coshx = 2ex + e - x
Then tanh is given by,
tanhx = coshxsinhx = ex + e - xex - e - x
For x = 0,tanhx = 0.
As x increases, value of tanhx also increases,
Also, as x decreases, the value of tanhx decreases.
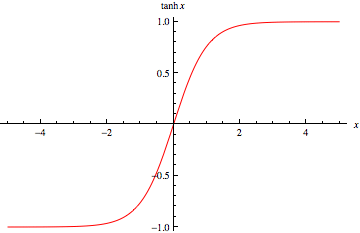
So, we can say that the graph of the hyperbolic tangent function is strictly increasing.
Therefore, the correct answer is option A.
Note: It is important to know the graph of the basic functions and how the value varies as x varies. Even though the graph is strictly increasing, the value of the function tends to 1 as x tends to infinity and -1 as x tends to negative infinity. This can be proved by taking the limits,
x→∞limtanhx=x→∞limex+e−xex−e−x =x→∞lim(1+e−2x)x→∞lim(1−e−2x) =1+x→∞lime−2x1−x→∞lime−2x =11 =1
Similarly, tanh tends to -1 when x tends to negative infinity. So the becomes almost straight at higher and lower values of x.