Question
Question: The graph of the hyperbolic tangent function for all real values is: A. Strictly increasing B....
The graph of the hyperbolic tangent function for all real values is:
A. Strictly increasing
B. Strictly decreasing
C. Strictly increasing in the interval [0,∞) and strictly decreasing in the interval (−∞,0]
D. Strictly increasing in the interval (−∞,0] and Strictly decreasing in the interval [0,∞)
Solution
We will write the value of tanhx as the ratio of hyperbolic sine function to hyperbolic cosine function. We will then draw a corresponding graph of the given function. Then, check the nature of the graph, that is where the graph is increasing or where the graph is decreasing.
Complete step by step solution:
The hyperbolic tangent function is the ratio of hyperbolic sine function to hyperbolic cosine function.
That is, tanhx=coshxsinhx
Now, the value of sinhx=2ex−e−x and the value of coshx=2ex+e−x
Then, we can write the hyperbolic function of tangent as
tanhx=2ex+e−x2ex−e−x=ex+e−xex−e−x
We will plot the graph of tanhx to identify the nature of the function.
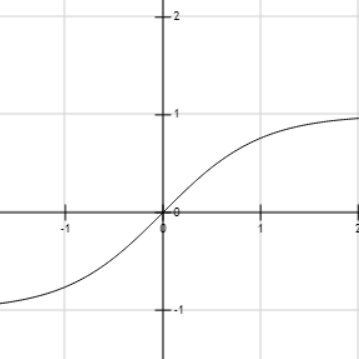
We can see that as the value of x increases, then the value of tanhx also increases.
Therefore, the graph of the hyperbolic tangent function for all real values is strictly increasing.
Note:
The value of tanhx=ex+e−xex−e−x. When xtends to infinity, tanhx tends to 1 such as
x→∞limtanhx=x→∞limex+e−xex−e−x =x→∞lim(1+e−2x)(1−e−2x) =1+x→∞lime−2x1−x→∞lime−2x =1
Similarly, when x tends to −∞, the value of tanhx tends to −1. Then, we can say that the value becomes almost the same for higher or lower values of x.