Question
Question: The graph of the equation \[xy = k\], where \[k < 0\], lies in which two of the quadrants shown abov...
The graph of the equation xy=k, where k<0, lies in which two of the quadrants shown above?
A) I and II
B) I and III
C) II and III
D) II and IV
E) III and IV
Solution
Here in this question, we have to find the quadrants which graph of the given equation lies, given the value of equation xy is k which is less than zero means k is the negative value so we have to check the quadrants in the graph weather one of the x or y value will be negative.
Complete step by step solution:
A quadrant is one of the four sections on a Cartesian plane. Each quadrant includes a combination of positive and negative values for x and y.
There are four graph quadrants that make up the Cartesian plane. Each graph quadrant has a distinct combination of positive and negative values.
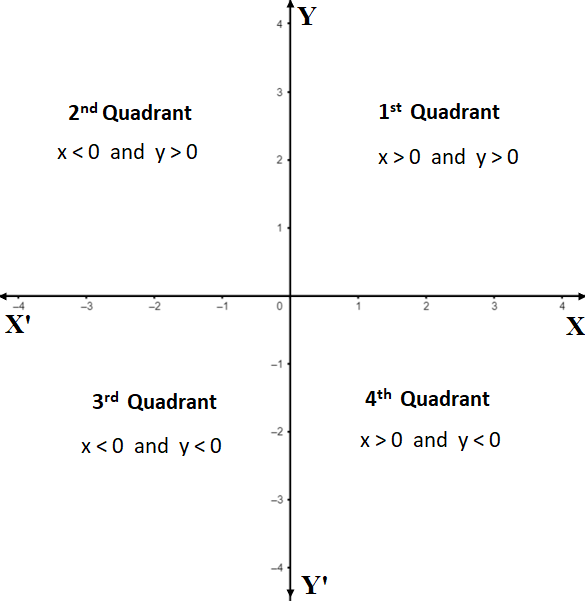
Quadrant I: The first quadrant is in the upper right-hand corner of the plane. Both x and y have positive values in this quadrant.
Quadrant II: The second quadrant is in the upper left-hand corner of the plane. X has negative values in this quadrant and y has positive values.
Quadrant III: The third quadrant is in the bottom left corner. Both x and y have negative values in this quadrant.
Quadrant IV: The fourth quadrant is in the bottom right corner. X has positive values in this quadrant and y has negative values.
Consider the given question
The given equation of graph is
⇒xy=k, where k<0
If the value k<0 (k will be the negative values), then “X” and “Y” must have different signs one of the values ‘X’ and ‘Y’ is negative.
The possible cases are:
x>0 and y<0, which is lies in IV quadrant
x<0 and y>0, which lie in II quadrant.
Hence, the graph of the equation xy=k, where k<0 lies in II and IV.
Therefore, option (D) is correct.
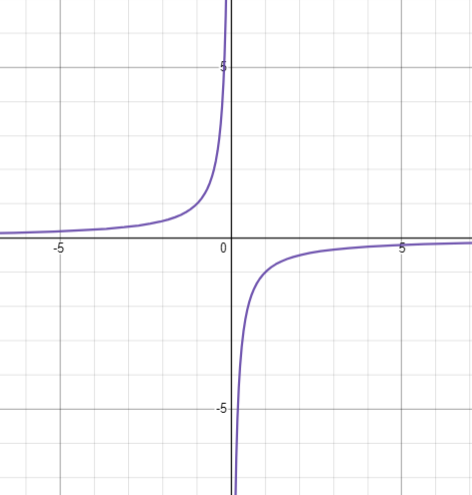
Example of the graph xy=−1 which lies in the second and the fourth quadrants.
Note:
A graph quadrant is one of four sections on a Cartesian plane. Each of the four sections has a specific combination of negative and positive values for x and y. We plot an ordered pair on graph quadrants. Ordered pairs have x and y values. x is the first value in an ordered pair; y is the second, the x value refers to the pair’s horizontal position on the graph. The y value refers to the vertical position.