Question
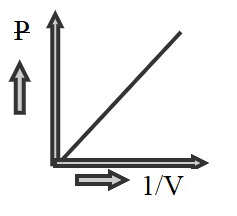
Question: The graph of P vs 1/V at constant temperature is- A) 
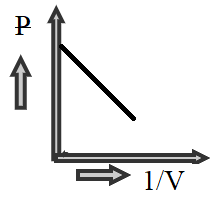
B)
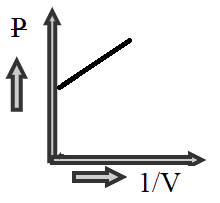
C)
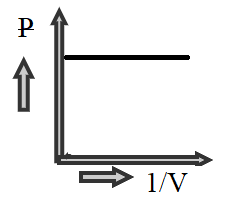
D)
Solution
We know that the fundamental measurements of gases are: volume, temperature and pressure. These terms are interrelated and affect each other. The volume of a given sample of gas depends upon the temperature and pressure applied to it.
Step by step answer: Boyle’s law gives the relationship between P and V by the hyperbola graph at constant temperature. The other two laws are charle’s law which states that at isobaric condition of constant pressure, volume of fixed mass of a gas is proportional to its temperature and gay lussac’s law that states at constant volume, the pressure of fixed mass of gas is directly proportional to the absolute temperature of the gas.
Any change in temperature or pressure will affect the volume of the gas. These relationships which describe the behavior of gases, are called gas laws. The laws are defined as:
Boyle’s law: it states that at constant temperature, the volume of a fixed mass of a gas is inversely proportional to its pressure. Mathematically it can be written as
Vα1/P V=K×1/P P=K×1/V
Hence we can see that P is directly proportional to 1/V , therefore at constant temperature general term of isotherm plot will be a straight line like in the graph shown below
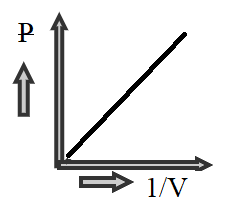
Hence the correct option is A.
Note: When a gas obeys these laws, it is said to be ideal or perfect gas. These laws are applicable only to gases which do not undergo a change in chemical complexity, when the temperature or pressure is varied.