Question
Question: The graph of Kinetic Energy (K) of a body versus velocity (v) is represented as (A) Hyperbola (B...
The graph of Kinetic Energy (K) of a body versus velocity (v) is represented as
(A) Hyperbola
(B) Parabola
(C) Straight line
(D) None of these
Solution
Hint
The kinetic energy of a body moving in a straight line is directly proportional to the square of its velocity. This also implies that it has a graph whose slope is not constant.
Formula used: K=21mv2 where m is the mass of the body and v is the velocity of its motion.
Complete step by step answer
Firstly, let us write down the formula for kinetic energy
⇒K=21mv2 where m is the mass of the body and v is the velocity of its motion.
For a graph of K versus v, K is analogous to y and v is analogous to x.
Thus, can be written representatively as y=ax2 where a is a constant equal to 21m.
Now, we compare each of the types of graph given in the option
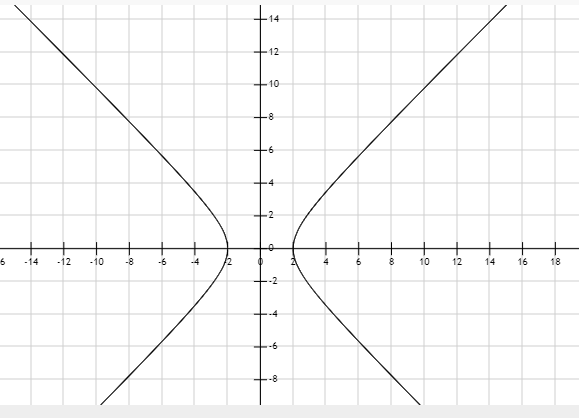
First, the hyperbola:
The algebraic equation of a hyperbola centered at the origin is given as:
⇒a2x2−b2y2=1 where a and b are constants.
Comparing this equation to y=ax2 it can be observed that no form of algebraic manipulation will make them the same since the variable y doesn’t have the same exponent. Thus, we can rule it out.
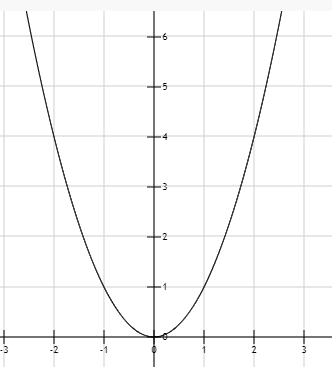
Next, we compare it to that of a parabola:
Equation of a parabola at the origin can be given as:
⇒y=4px2 where p is a constant
Comparing this to equation y=ax2, we can see that they are identical if we make a=4p. Thus, the equations are both equations of a parabola. In fact, y=4px2 is only called the focal point form while y=ax2 is called the Cartesian form.
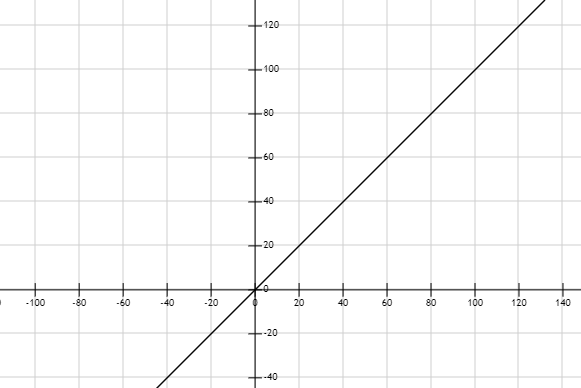
The equation of a straight line is y=ax. Comparing this with y=ax2 we also see that the exponent of x is not the same in the two equations. Thus, can be ruled out.
Therefore, we can conclude that the graph of kinetic energy versus velocity is represented by a parabola.
Hence, the correct option is B.
Note
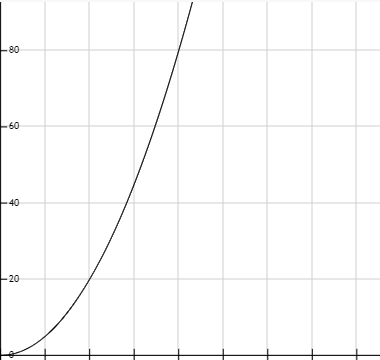
Alternatively, we can actually compare the graphs each with a sketch of K against v.
A quick sketch of K against v will give something similar to the graph below
For hyperbola:
For parabola:
And for straight line:
Comparing the graphs with the sketch of kinetic energy, we see that the most matching graph is that of the parabola but with the x-axis cut off.