Question
Question: The graph of a quadratic polynomial y = ax²+ bx +c is as shown in the adjacent figure. Which of the ...
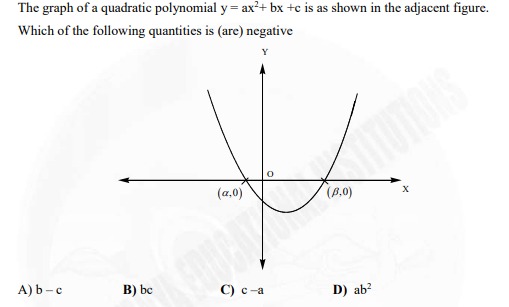
The graph of a quadratic polynomial y = ax²+ bx +c is as shown in the adjacent figure. Which of the following quantities is (are) negative
A
b – c
B
bc
C
c – a
D
ab²
Answer
c – a
Explanation
Solution
From the graph of the quadratic polynomial y=ax2+bx+c, we determine the signs of the coefficients a, b, and c.
- The parabola opens upwards, so a>0.
- The y-intercept is at (0,c), and it is below the x-axis, so c<0.
- The x-coordinate of the vertex is −2ab, and it is positive from the graph. Since a>0, we have −b>0, which means b<0.
So, we have a>0, b<0, and c<0.
Now we check the signs of the given quantities:
A) b−c: Since b and c are both negative, the sign of b−c depends on their relative magnitudes. It can be positive or negative. B) bc: Since b<0 and c<0, bc=(−ve)×(−ve)=+ve. C) c−a: Since c<0 and a>0, c−a=(−ve)−(+ve)=(−ve)+(−ve)=−ve. D) ab2: Since a>0 and b<0, b2>0. So ab2=(+ve)×(+ve)=+ve.
Therefore, the only quantity that is always negative is c−a.