Question
Question: The graph given shows an oxygen dissociations curve for haemoglobin. <img src="https://cdn.pureesse...
The graph given shows an oxygen dissociations curve for haemoglobin.
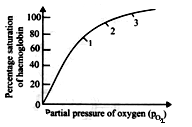
Where in the body will haemoglobin e saturated at the percentages shown at points 1,2 and 3 on the graph ?
Left ventricle Pulmonary vein Vena cave
A
2 3 1
B
1 2 3
C
2 1 3
D
3 2 1
Answer
2 3 1