Question
Question: The graph between \({v^2}\) versus \(s\) of a particle moving in a straight line is as shown in figu...
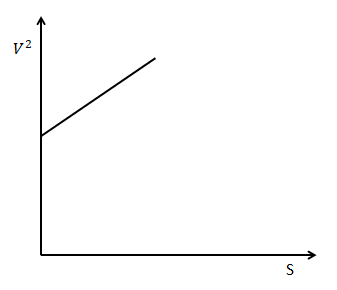
The graph between v2 versus s of a particle moving in a straight line is as shown in figure. From the graph some conclusions are drawn. State which statement is wrong?
(A) The given graph shows uniform acceleration motion.
(B) Initial velocity of the particle is zero.
(C) Corresponding s−t graph will be a parabola.
(D) None of the above.
Solution
Here the graph is drawn with velocity square along the x axis and displacement along the y axis. The tangent to the angle made by the line with the x axis gives the slope of the straight line. Using the v2 versus s graph, write the equation of a line and compare it to the kinematic equation. By comparing we will be able to tell about its acceleration, initial acceleration.
Formula used:
y=mx+c
Where y is the value where the line cuts y axis.
v2=u2+2as
Where v is the final velocity, u is the initial velocity, a is the acceleration, s is the displacement.
Complete step by step solution:
Graphical analysis is a convenient method to study the motion of studying the motion of a particle. The motion situation of a particle can be effectively analysed by graphical representation.
For graphical representation, we require two coordinate axes. The usual practice is to take the independent variable along the x axis and dependent variable along the y axis.
First from the graph v2 versus s let us write the line equation:
v2=cs+c1
Where c and c1 are constants
Kinematic equation of motion
v2=2as+u2
Comparing the two equations we can say the acceleration is uniform.
Since acceleration is uniform, we can s∝t2. Hence s−t graph will be a parabola.
If s=0 in the equation v2=cs+c1, we get v2=c1 from this we can say that initial velocity is not zero.
Hence option (B) is the right option.
Note: The tangent to the angle made along the x axis gives the slope of the straight line. The motion situation of a particle can be effectively analysed by graphical representation. Graphical analysis can be effectively applied to analyse the motion situation of a particle. A graph can be drawn by using the two coordinates one along the x axis and one along the y axis. Here the x axis contains an independent variable.