Question
Question: The graph between the stopping potential \( {V_ \circ } \) and frequency \( v \) for two different m...
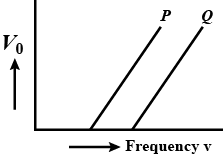
The graph between the stopping potential V∘ and frequency v for two different metal plates P and Q are shown in the figure. Which of the metals has greater threshold wavelength and work function?
Solution
Hint : The work function of a metal is the amount of energy that is required to emit an electron from
Its surface. The work function is inversely related to the threshold wavelength. The threshold wavelength is the
Wavelength at which the any given metal emits an electron when light of the desired wavelength is emitted on
it. Also remember that frequency is inversely proportional to the wavelength so the more is the frequency of
light the lesser is the wavelength (in this case it is called as threshold wavelength)
Complete Step By Step Answer:
We know threshold frequency and threshold wavelength are related to each other by the formula:
λ∝ν1
The more the value of threshold frequency, the lesser is the wavelength. Since Q in this case has more
Threshold frequency we will say it has less wavelength. So Q will have the more threshold wavelength also we
That more the threshold wavelength less is the work function by the formula:
W0=hν0
We see that the work function is inversely proportional to the frequency so we can say since Q has more
Frequency the metal Q here has more work function.
Note :
The value of h here is called as Planck’s constant it is the fundamental parameter of the universe was given by Max Planck and its value is:
h= 6.63 × 10⁻³⁴J s.