Question
Question: The graph between stopping potential ($V_0$) versus frequency ($\nu$) of the light used in an experi...
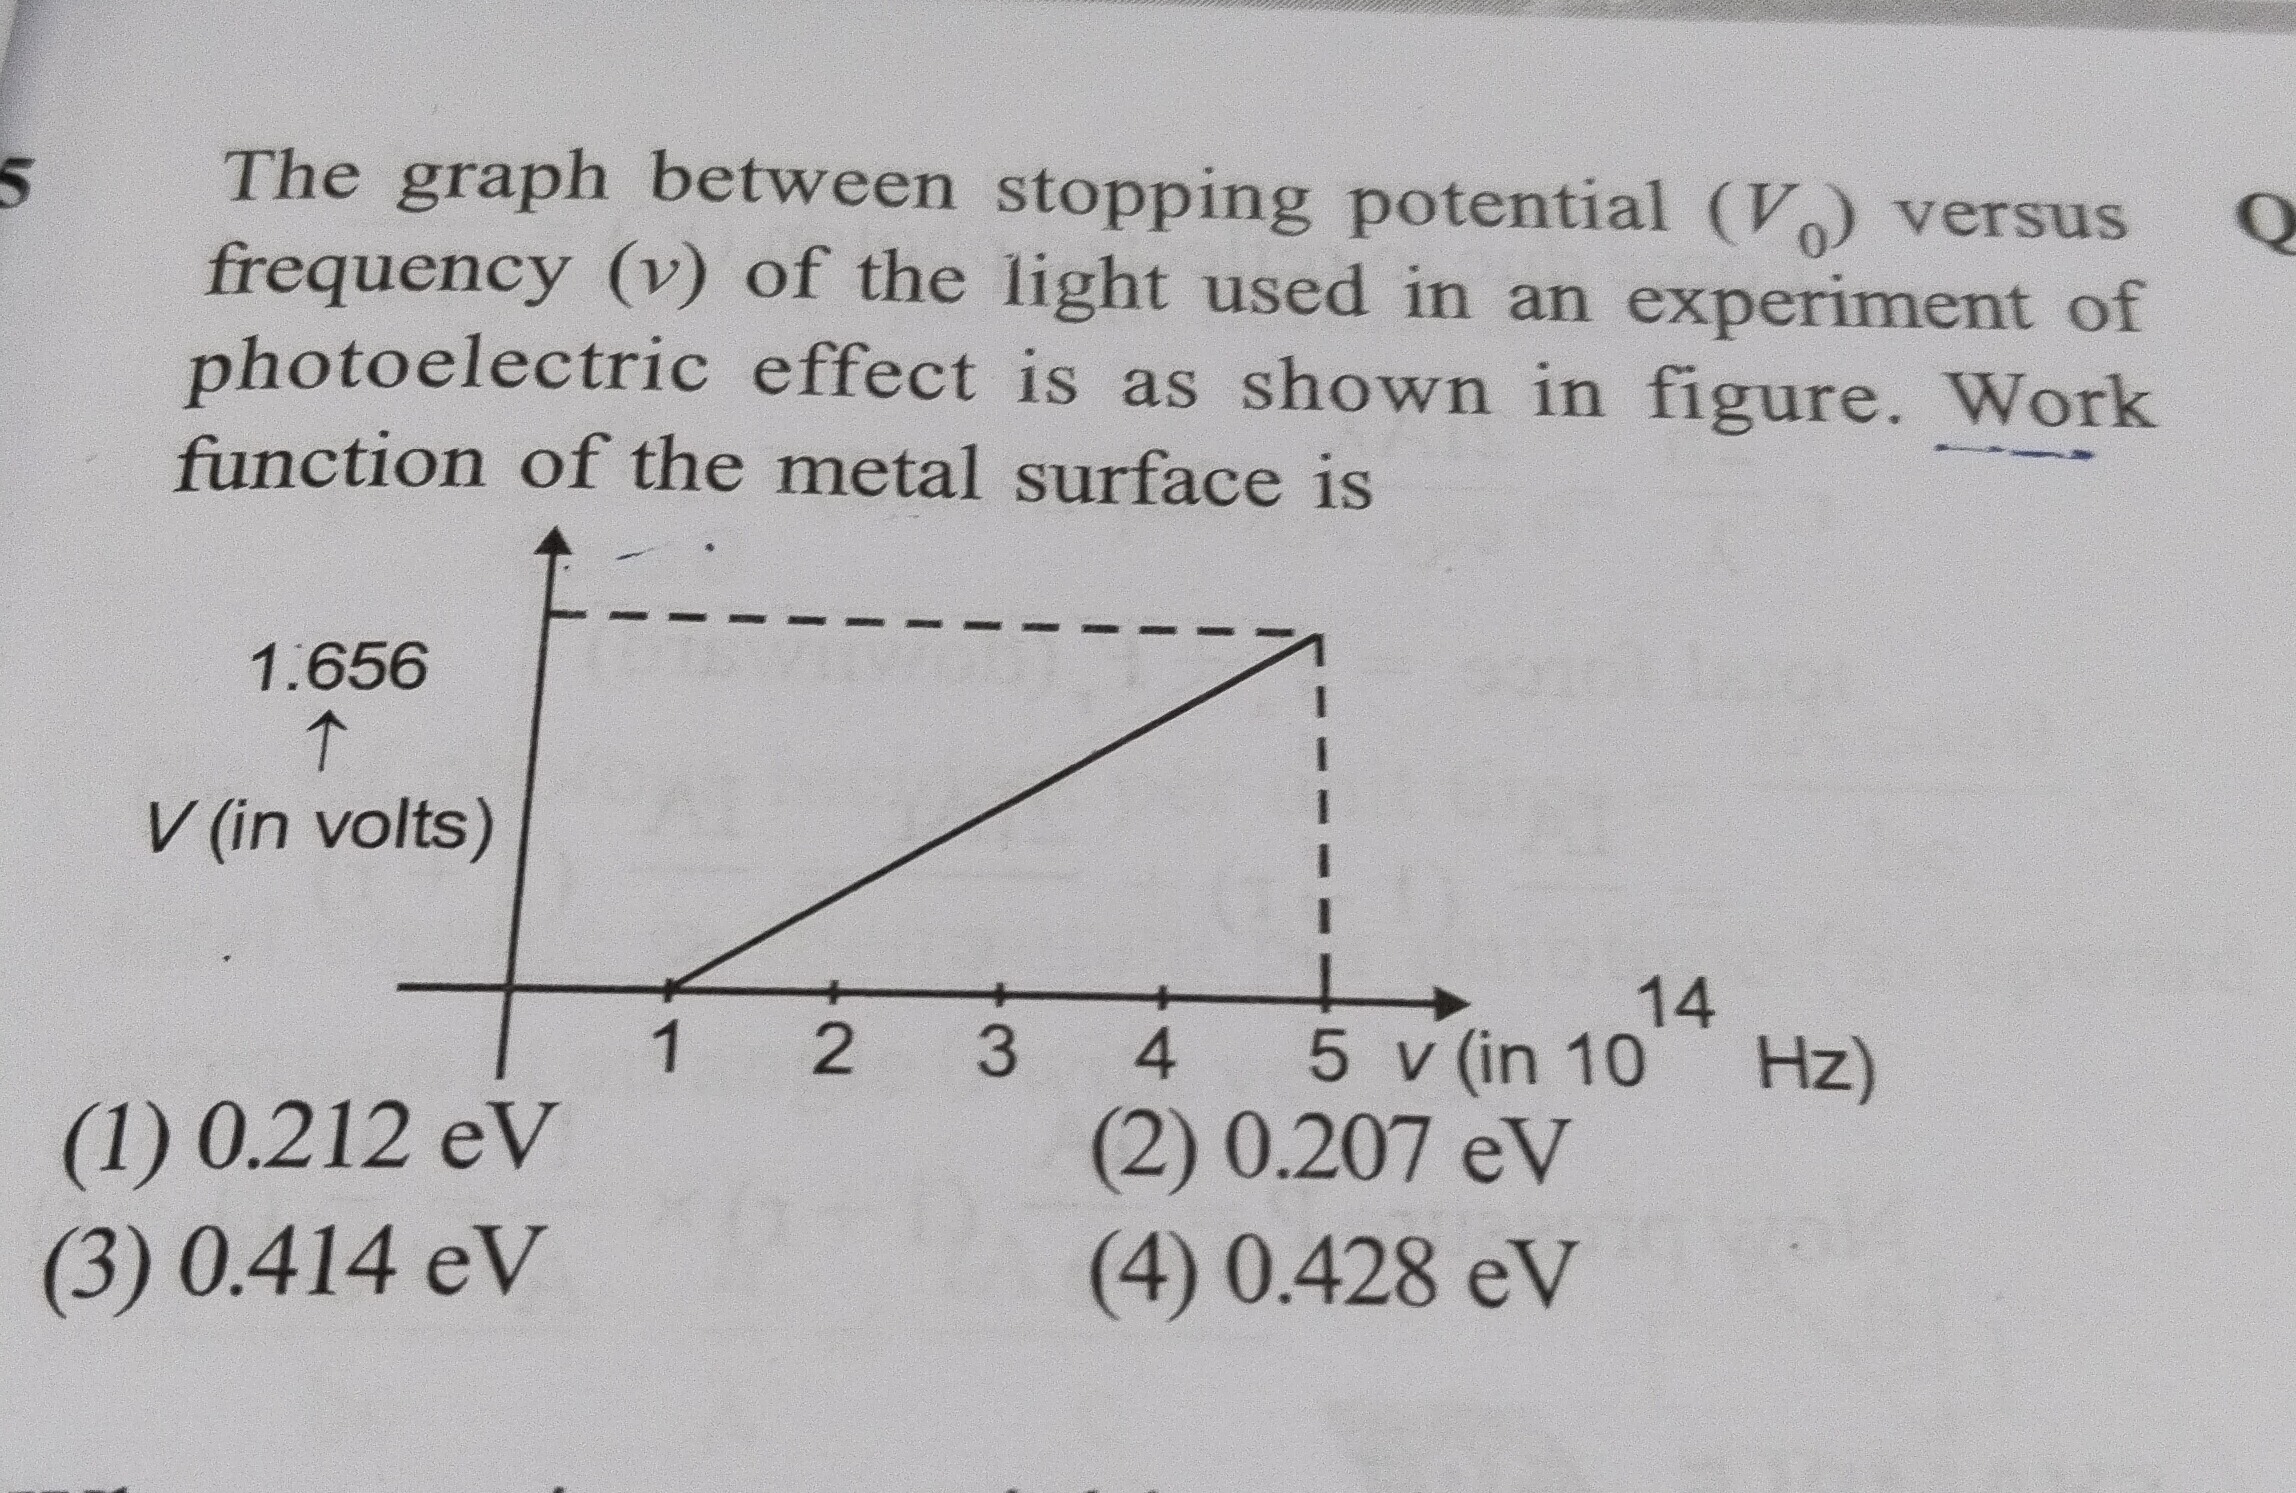
The graph between stopping potential (V0) versus frequency (ν) of the light used in an experiment of photoelectric effect is as shown in figure. Work function of the metal surface is
0.212 eV
0.207 eV
0.414 eV
0.428 eV
0.414 eV
Solution
The relationship between stopping potential (V0) and frequency (ν) in the photoelectric effect is given by Einstein's photoelectric equation:
hν=ϕ+Kmax
where h is Planck's constant, ϕ is the work function, and Kmax is the maximum kinetic energy of the emitted photoelectrons. The maximum kinetic energy is also related to the stopping potential (V0) by:
Kmax=eV0
where e is the elementary charge.
Substituting Kmax into the photoelectric equation:
hν=ϕ+eV0
Rearranging the equation to express V0:
eV0=hν−ϕ V0=(eh)ν−(eϕ)
This equation is in the form of a straight line, y=mx+c, where:
- y=V0 (stopping potential)
- x=ν (frequency)
- The slope m=eh
- The y-intercept c=−eϕ
From the graph, we can determine the work function (ϕ) using the threshold frequency (ν0). The threshold frequency (ν0) is the minimum frequency of incident light required for photoemission to occur. At this frequency, the stopping potential (V0) is zero.
From the photoelectric equation, when V0=0:
hν0=ϕ
The graph shows that the line intersects the frequency axis (where V0=0) at ν=1×10¹⁴ Hz. So, the threshold frequency ν0=1×10¹⁴ Hz.
Now, we can calculate the work function:
ϕ=hν0
Using Planck's constant h=6.626×10⁻³⁴ J s:
ϕ=(6.626×10⁻³⁴ J s)×(1×10¹⁴ Hz) ϕ=6.626×10⁻²⁰ J
To express the work function in electron volts (eV), we divide by the elementary charge e=1.602×10⁻¹⁹ J/eV:
ϕ=1.602×10⁻¹⁹ J/eV6.626×10−20 J ϕ≈0.4136 eV
Rounding to three significant figures, ϕ≈0.414 eV.