Question
Question: The graph \(AB\) shown in figure is a plot of temperature of a body in degree Celsius and degree Fah...
The graph AB shown in figure is a plot of temperature of a body in degree Celsius and degree Fahrenheit. Then

A. Slope of line AB is 59
B. Slope of lineAB is 95
C. Slope of line AB is 91
D. Slope of line AB is 93
Solution
In this question, the concept of the slope of the straight line is used. As we know that one of the methods for calculating the slope of the straight we need two coordinate points on the linear line from which we can calculate the slope.
Complete step by step answer:
In this question, we have given a plot of temperature of a body in degree Celsius and degree Fahrenheit. We need to find the slope of the given graph.
As we know that the slope of the straight line can be calculated by using the expression,
m=x2−x1y2−y1......(1)
Where, the coordinates of the linear line are (x1,y1) and (x2,y2).
Let us consider the given graph of the temperature of a body in degree Celsius and degree Fahrenheit as,
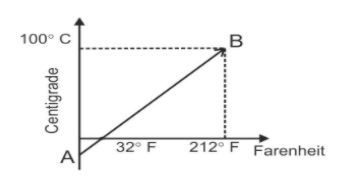
Now, in the given graph of the Celsius and the Fahrenheit scale, the coordinates are (32,0) and (212,100).
Now, we compare the coordinates that is (x1,y1) is equal to (32,0) and (x2,y2) is equal to (212,100).
Now, we substitute these coordinates in equation (1) as,
⇒m=212−32100−0......(1)
Now, we simplify the above calculation and get,
⇒m=180100
After simplification we get,
∴m=95
Therefore, the correct option is B.
Note: As we know that the boiling point temperature of the water in Fahrenheit scale is 212∘F and in the Celsius scale it is 100∘C while the freezing point temperature of the water in Fahrenheit scale is 32∘F and in the Celsius scale it is 0∘C. The conversion of the Celsius scale to Fahrenheit scale can be done by the equation of relation between Celsius and Fahrenheit scale of temperature as,
⇒5C=9F−32