Question
Question: The given P-U graphs show the variation of internal energy of an ideal gas with increase in pressure...
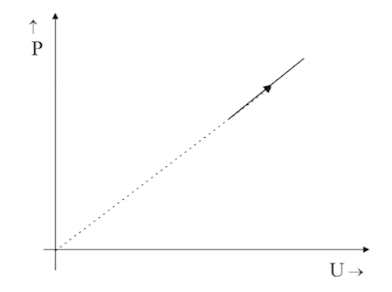
The given P-U graphs show the variation of internal energy of an ideal gas with increase in pressure. Which of the following pressure volume graphs is equivalent to this graph?
(A) 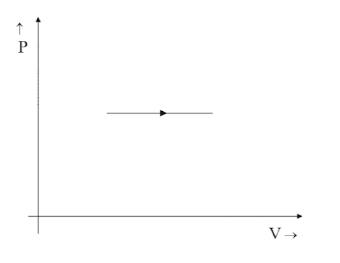
(B) 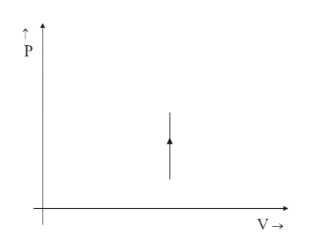
(C) 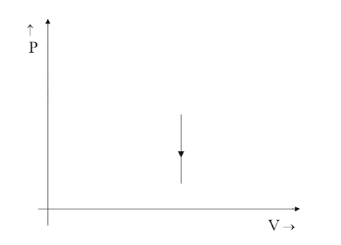
(D) 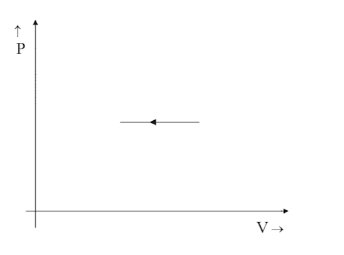
Solution
The P-U graph is a straight line passing through origin, thus making an angle of 45∘ with both the X-axis and Y-axis. This clearly states that P∝U . Also, Temperature and Volume are related by the ideal gas equation, PV=nRT .
Formulas Used: We use the formulas PV=nRT where P is the pressure of the gas, V is the volume of the gas, n is the number of moles of the gas, R is the gas constant, and T is the temperature of the gas. We would also be using the formula U=23RT where U is the internal energy of the system.
Complete Step by Step solution
Internal energy is one of the thermodynamic properties of an ideal gas. The internal energy is basically the sum of all the energies an ideal gas possesses. Usually internal energy is only the sum of Kinetic energy and Potential energy. But in case of an ideal gas, the particle of the ideal gas does not interact with each other, hence it does not possess any potential energy. Also, this also suggests that the internal energy of an ideal gas is nothing but the sum of the kinetic energy of its particle.
We also know that according to kinetic molecular theory the temperature of a gas is directly proportional to the average of its kinetic energy. Thus proposing the relation U=23RT , thus stating that the temperature of the ideal gas T and the internal energy of the ideal gas U is also directly proportional to each other.
⇒T∝U
The graph we have is a P-U graph that depicts that the Pressure P and internal energy U are proportional to each other directly. P∝U .
Since both P and T are directly proportional to U ⇒P∝T .
We know that PV=nRT
⇒T=nRPV .
So, substituting T=nRPV in P∝T we get,
P∝nRPV ⇒1∝nRV
So V does not vary with the variables and hence remains constant, since the relation should be calculated for unit mole (n=1) and R is a gas constant.
Thus V remains constant, which is a line that is straight and parallel to the Y-axis in the positive direction.
Hence option B is correct.
Note
Since the relation would be 1∝V the graph would point up in the positive direction stating it is increasing with increasing values of the Y-axis and not the opposite. That is why option C is ruled out even though the graph is a straight line parallel to Y-axis.