Question
Question: The given line graph shows the growth rate of a kitten. During which two month period the kitten wei...
The given line graph shows the growth rate of a kitten. During which two month period the kitten weight increased the most?

A. 0 to 2 months
B. 2 to 4 months
C. 4 to 6 months
D. 6 to 8 months
Solution
The given questions revolve around the concepts of data handling tools such as line graph. A line graph is a way of representing a data set in the form of a graph using straight lines to indicate the value of a quantity. One must know how to read a line graph using the values of the quantities that are represented through the graph. Also, we should know how to check the change in quantities by judging the slope and inclination of the straight lines.
Complete step by step answer:
In the given question, we are provided with the line graph shown below.
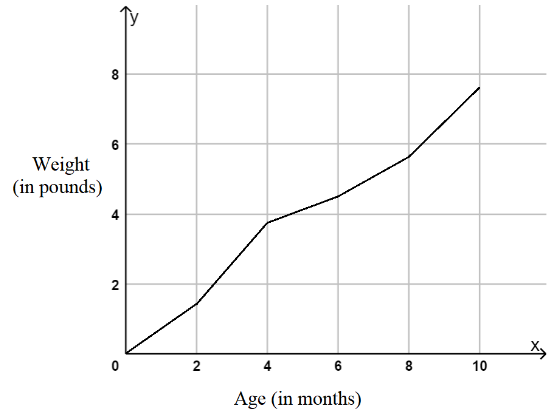
We are required to find the two month period in which the weight of the kitten increased the most. We can get an idea about the change in the weight of the kitten by comparing the slopes and inclinations of the straight lines in the line graphs.Now, we see that the line graph shown is the steepest in the period of 2 months to 4 months.
So, this means that the slope of the line graph is the maximum in the period of 2 months to 4 months. Also, the slope is positive in the graph throughout. This means that the kitten's weight of kitten is increasing with time. Hence, the two month period in which the weight of the kitten increased the most is from 2 months to 4 months.
Hence, the correct answer is option B.
Note: One must know how to read line graphs correctly as the given questions tests the ability to do so. We also must be aware of the scale which is used in a line graph before solving such problems as it affects the final answer to a great extent. We must know the applications of derivatives and slope of a straight line to judge the change in the quantities in a line graph.