Question
Question: The given indicator diagram shows the variation of pressure with volume, when a thermodynamic system...
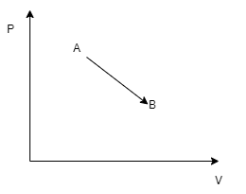
The given indicator diagram shows the variation of pressure with volume, when a thermodynamic system is taken from state A to state B. Identify what happens during the process?
a.The System is cooled
b.The System is Heated
c.The System heated first and then cooled
d.The System cooled first and then heated
Solution
Apply gas law equations with respect to origin points and the given A and B points. Extend the graph so that it touches the poles. Now, using the equation identify the relation between temperature and volume. Conclude using the relation
Complete answer:
From the diagram , we can deduce that A and B are processes of a gas. Let us assume that the gas state given on the diagram is ideal gas. If a gas is said to be ideal and is identified to have 2 states of existence then , we can use the relation,
T1P1V1=T2P2V2
Here, we don’t know the temperature T1 and T2 at position A and B respectively. We apply the gas laws we know for the particular gas and identify the pattern with respect to pressure and volume.
According to Charles law , which states that for a given gas mass, the volume of the gas is directly proportional to the absolute temperature, provided the pressure is constant.
Which means that
TAVA=TBVB
Now, rearranging with like terms on one side,
VBVA=TBTA
This means that greater than value of V, smaller the value of T. In our diagram, V increases in State B. This means that the temperature at point B is lower than point A.
Hence temperature at point A is higher than point B. From (0,0) ,the gas is heated to temperature TA, so that it attains a pressure PA and Volume VA and then cools down to TB.
Thus , Option(c) is the right answer for the given question.
Note:
We can also use Boyle’s law to arrive at the given conclusion using pressure as a factor instead of volume.