Question
Question: The function \[f\] is defined by \[f(x) = \left\\{ 1 - x,x < 0 \\\ 1,x = 0 \\\ x + ...
The function f is defined by
1 - x,x < 0 \\\ 1,x = 0 \\\ x + 1,x > 0 \\\ \right.$$ . Draw the graph of $$f(x)$$ .Solution
A function is nothing but an expression which defines a relationship between the independent variable and the dependent variable. For instance, let us consider a function f(x)=y , here y is the dependent variable and x is the independent variable. The variable y will get a value for each value of x .
Complete step by step answer:
It is given that f(x) = \left\\{
1 - x,x < 0 \\\
1,x = 0 \\\
x + 1,x > 0 \\\
\right.
that is,
When x<0 , f(x)=1−x
When x=0 , f(x)=1
When x>0 , f(x)=x+1
First, we have to find the points from the given function.
It is given that, when x<0 , f(x)=1−x , so x can take values like x=−1,−2,−3,−4,... .
Let’s substitute the values of x in the function.
For x=−1 , f(−1)=1−(−1)=1+1=2 . So, the point is (−1,2) .
For x=−2 , f(−2)=1−(−2)=1+2=3 . So, the point is (−2,3) .
For x=−3 , f(−3)=1−(−3)=1+3=4 . So, the point is (−3,4) .
For x=−4 , f(−4)=1−(−4)=1+4=5 . So, the point is (−4,5) .
We can keep on finding the point since there is no limit for the x value, so we will stop here. Let us find the points for the next condition.
It is given that, when x=0 , f(x)=1 . Here x has only one value that is 0, so f(0)=1 . So, the point is (0,1) .
Now let us find the points for the next condition.
It is given that, when x>0 , f(x)=x+1 , so x can take values like x=1,2,3,4,... .
Let’s substitute the values of x in the function.
For x=1 , f(1)=1+1=2 . So, the point is (1,2) .
For x=2 , f(2)=2+1=3 . So, the point is (2,3) .
For x=3 , f(3)=3+1=4 . So, the point is (3,4) .
For x=4 , f(4)=4+1=5 . So, the point is (4,5) .
Now let’s plot these points in the graph with the scale x axis 1unit=1cm and y axis 1unit=1cm and join the points.
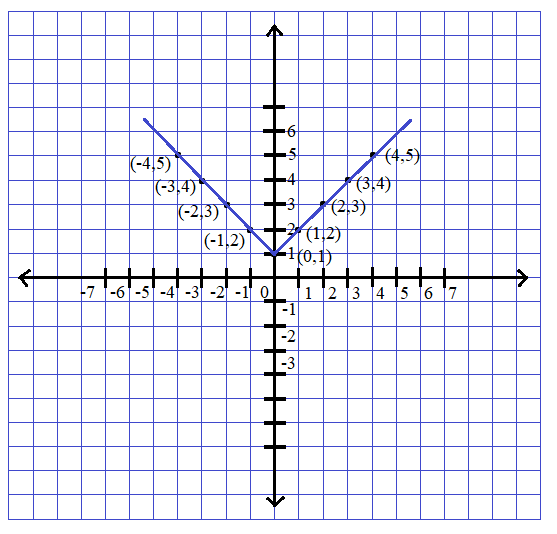
This is the required graph for the given function.
Note: Since the condition of the given problem doesn’t have any limit point, we have found some points to plot it in the graph. Point to remember while drawing graph: Scale of the graph is important; it has to be uniform. The given function doesn’t stop anywhere since x has indefinite values, we will be getting a value of y for each value of x .