Question
Question: The frequency response curve of RC coupled amplifier is shown in figure. The band width of the ampli...
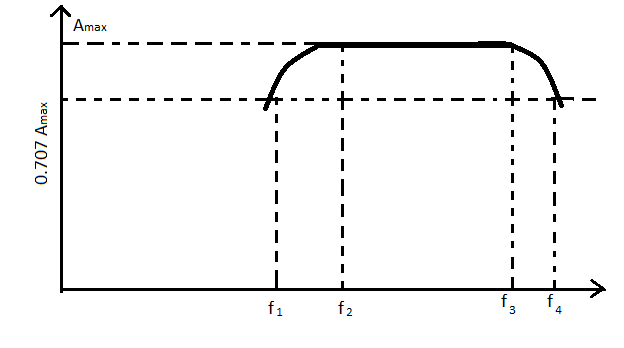
The frequency response curve of RC coupled amplifier is shown in figure. The band width of the amplifier will be
A. f3−f2
B. f4−f1
C. 2f4−f2
D. f3−f1
Solution
We have studied that the frequency response curve of RC coupled amplifiers indicate the relation between the voltage gain and function of frequency. In the frequency response graph the frequency rolls off or decreases that means the capacitive reactance is proportional to the frequency. Capacitive reactance can be given as Xc=2πfc1 which shows that capacitive reactance is inversely proportional to the frequency. At high frequencies the capacitive reactance becomes low so the capacitor behaves as a short circuit. We can see in the given graph that at mid frequencies the voltage gain is maintained constant in this range of frequencies.
Complete answer:
We know that bandwidth can be defined as the range of frequency where the amplitude is greater than or equal to the maximum value. In other words it can be said it is the range of frequency that can be easily amplified. This is measured on the basis of half power points (points where output power becomes half of the maximum output power in the frequency vs output graph. In the given graph we can see that at frequency f4 and f1 , the amplitude at y-axis is 2Amax.Thus the bandwidth will be f4−f1. The band width of the RC coupled amplifier will be f4−f1 .
So, the correct answer is “Option B”.
Note:
We can conclude from the frequency response of RC coupled amplifiers that provides a constant gain over a wide range and which makes it most suitable for audio application. It is also used as a voltage amplifier.