Question
Question: The following table shows the percentage of the students of a school who participated in elections a...
The following table shows the percentage of the students of a school who participated in elections and drawing competitions.
| Competition | Election | Drawing | Both |
|---|---|---|---|
| Percentage of students | 55 | 45 | 20 |
Draw a Venn diagram to represent this information and use it to find the percentage of the students who
(i) Participated in Election only
(ii) Participated in Drawing only
(iii) Did not participate in any one of the competitions.
Solution
The percentage of the students who participated in elections, drawing competitions, and both are 55%, 45%, and 20% respectively. Now, get the percentage of students who participated in elections only, drawing competitions only, and neither election nor drawing competitions. Now, draw the Venn diagram.
Complete step by step answer:
According to the question, we have a table showing the percentage of the students of a school who participated in elections and drawing competitions.
| Competition | Election | Drawing | Both |
|---|---|---|---|
| Percentage of students | 55 | 45 | 20 |
Here, from the table, we have the following information,
The percentage of students who participated in elections = 55 ……………………………………(1)
The percentage of students who participated in drawing competitions = 45 ……………………………………(2)
The percentage of the students who participated in both elections and the drawing competitions = 20 …………………………………………. (3)
We can get the percentage of students who participated in elections only by subtracting equation (3) from equation (1).
The percentage of students who participated in elections only = 55−20=35 ………………………………(4)
Similarly, we can get the percentage of students who participated in drawing competitions only by subtracting equation (3) from equation (2).
The percentage of students who participated in drawing competitions only = 45−20=25 ………………………………(5)
Now, plotting the Venn diagram for the given information,
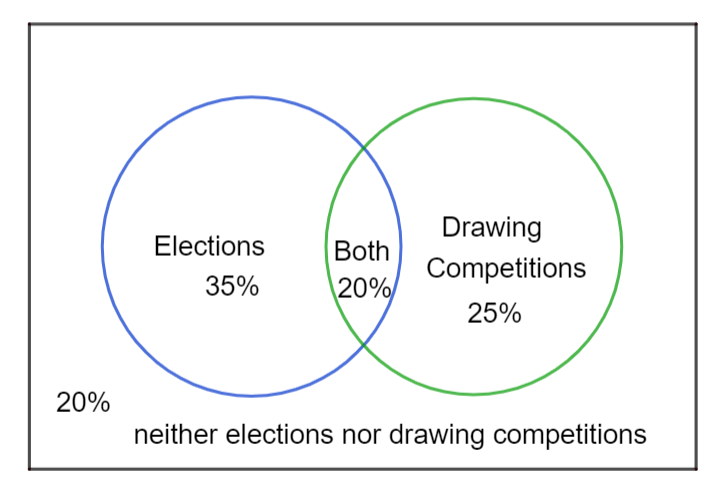
From the Venn diagram, we have
(a) The percentage of students who participated in elections = 35%.
(b) The percentage of students who participated in drawing competitions = 25%.
The percentage of students who participated in both elections and drawing competitions = 20%.
(c) The percentage of students who participated in neither elections nor drawing competitions = 20%.
Note: In this question, one might make a silly mistake and take the percentage of students who participated in elections equal to 55%. This is wrong because 55% is the percentage of students who participated in elections and also some of the percentages of students who participated in drawing competitions too.