Question
Question: The following table shows a record from a hospital of 84 numbers of casualties due to accidents of d...
The following table shows a record from a hospital of 84 numbers of casualties due to accidents of different age groups.
| Age (in years) | 5-15 | 15-25 | 25-35 | 35-45 | 45-55 | 55-65 | 65-75 |
|---|---|---|---|---|---|---|---|
| No. of casualties | 6 | 10 | 15 | 13 | 25 | 8 | 7 |
Taking a scale of 2cm = 10 years on one axis and 2 cm = 10 casualties on the other. Draw an ogive and estimate:
(i)The median.
(ii)The upper quartile.
(iii)The number of casualties above 57 years.
Solution
To find the median and upper quartile of a given data firstly we have to draw less than type of given data and then we calculate median and upper quartile from the graph.
Complete step-by-step answer:
The given data is continuous and total frequency = 84. The less than type cumulative frequency is given as:
| Age ( in years) | Cumulative frequency |
|---|---|
| Less than 15 | 6 |
| Less than 25 | 6 + 10 = 16 |
| Less than 35 | 16 + 15 = 31 |
| Less than 45 | 31 + 13 = 44 |
| Less than 55 | 44 + 25 = 69 |
| Less than 65 | 69 + 8 = 77 |
| Less than 75 | 77 + 7 = 84 |
We draw less than type ogive on graph
To find Median:
Total frequency = 84 (even)
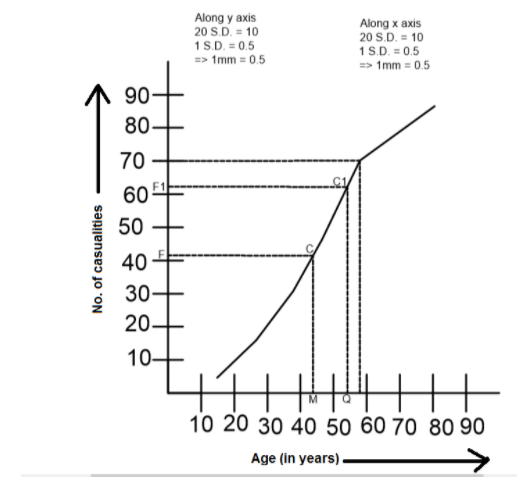
So the mean of2N and 2N+1 i.e. the mean of 42 and 43 is 42.5. The point F on Y-axis represents the cumulative frequency of 42.5. Draw Fc II X-axis, which cut the ogive at C. Draw CM Xaxis. The point M represents the median.
So Median = 44
To find Upper quartile 43N=3×484=63
The point F2 on the Y axis represents cumulative frequency 63. Drawf1C1 X axis. Which cut the ogive at C1. DrawC1Q ⊥Xaxis. The Point Q represents the upper quartile.
∴ Upper quartile = 53
To find the number of casualties above 57.
Draw line ∥Y axis from (57) which meet at C2. Draw C2F2∥Xaxis . The F2is at 70.5
So, the number of casualties above 57 is 7.
Note: Median is the middle number in a sorted list of numbers and can be more descriptive of that data set than the average.
A quartile is a statistical term that describes a division of observations into four defined intervals based on the values of the data and how they compose to the entire set of observations.