Question
Question: The following table gives the values of the angle of deviation, for different values of the angle of...
The following table gives the values of the angle of deviation, for different values of the angle of incidence, for a triangular prism:
| Angle of Incidence | 33∘ | 38∘ | 42∘ | 52∘ | 60∘ | 71∘ |
|---|---|---|---|---|---|---|
| Angle of Deviation | 60∘ | 50∘ | 46∘ | 40∘ | 43∘ | 50∘ |
For what value of the angle of incidence, is the angle of emergence likely to be equal to the angle of incidence itself?
Solution
in order to solve the question, we will make the graph between angle of deviation and the angle of incidence, for a triangular prism and to find then by using the graph we will find at value the angle of incidence is equal to angle of incidence and hence we will reach to the answer
Complete step-by-step solution:
In the question we are given the table which have the values of the angle of deviation, for different values of the angle of incidence, for a triangular prism
the point at which value the angle of incidence is equal to angle of deviation is called the minimum deviation it is the only point for both angle of incidence and angle of deviation
This is the table given in question we will plot the graph between angle of incidence and angle of deviation
| Angle of Incidence | 33∘ | 38∘ | 42∘ | 52∘ | 60∘ | 71∘ |
|---|---|---|---|---|---|---|
| Angle of Deviation | 60∘ | 50∘ | 46∘ | 40∘ | 43∘ | 50∘ |
In the graph we have taken angle of incident at y axis and angle of deviation at x axis along with this both the axis has each unit equal to 5∘
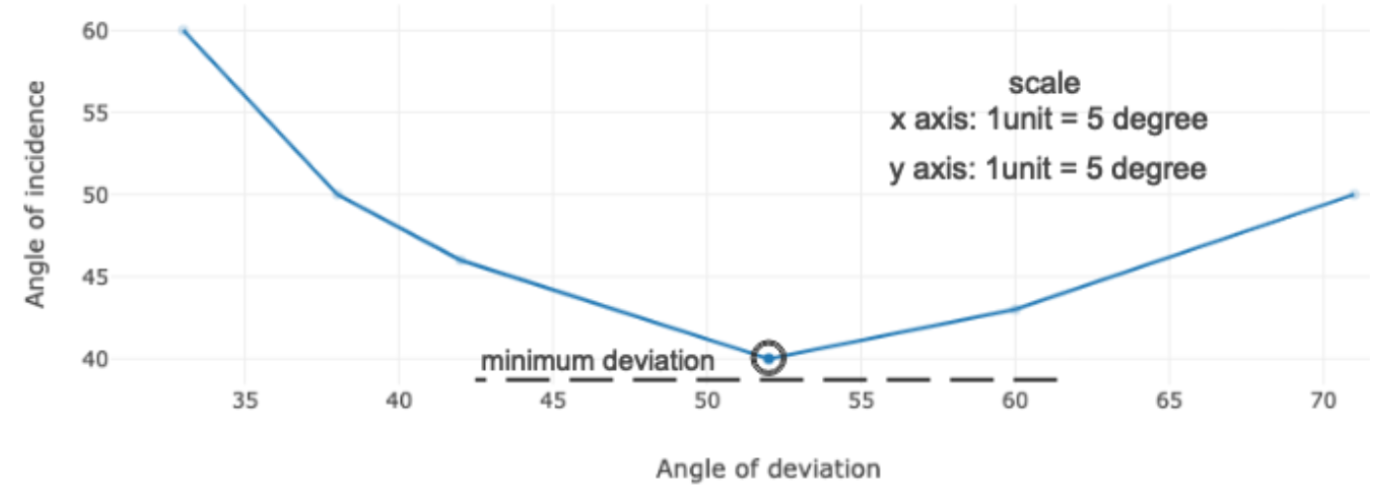
We can clearly see in the graph minimum deviation that is when value the angle of incidence is equal to angle of deviation is at 40∘
Hence, the correct answer is 40∘ the minimum deviation.
Note: Many of the people will make the mistake in the graph by not taking both the scale equal instead of that plotting the point according to the values but this will create mess and the graph will become untidy as well as wrong along with this marking the minimum deviation in the graph clarify the answer