Question
Question: The following graph shows the temperature forecast and the actual temperature for each day of a week...
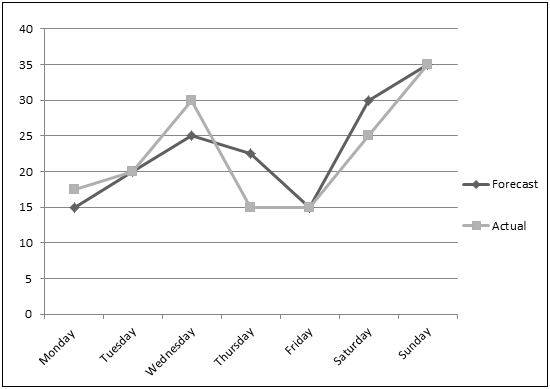
The following graph shows the temperature forecast and the actual temperature for each day of a week.
(A) On which day was the forecast temperature the same as the actual temperature?
(B) What was the maximum forecast temperature during the week?
(C) What was the minimum actual temperature during the week?
(D) On which day did the actual temperature differ the most from the forecast temperature?
Solution
This is a graphical presentation question.
To find the correct accurate answer, we need to find out the real values of forecast temperature and actual temperature.
So that it becomes easy to find the answers.
Complete step-by-step solution:
First we will summarize the data given from the graphical representation to tabular representation.
Finding the values represented in the graph are easy, we need to spot out the mark in the graph and carefully note the units.
If the mark is in between the two numbers, then find the mid-value by using,
21stnumber+2ndnumber
| Day | Actual temperature | Forecast temperature |
|---|---|---|
| Monday | 17.5 | 15 |
| Tuesday | 20 | 20 |
| Wednesday | 30 | 25 |
| Thursday | 15 | 27.5 |
| Friday | 15 | 15 |
| Saturday | 25 | 30 |
| Sunday | 35 | 35 |
Now,
A) On which day was the forecast temperature the same as the actual temperature?
From the table observation, we need to find on which day the forecast temperature is the same as actual temperature.
Tuesday =20
Friday = 15
Sunday = 35
Therefore the answer is Tuesday, Friday, Sunday.
B) What was the maximum forecast temperature during the week?
From the table we can see that,
| Day | Forecast temperature |
|---|---|
| Monday | 15 |
| Tuesday | 20 |
| Wednesday | 25 |
| Thursday | 27.5 |
| Friday | 15 |
| Saturday | 30 |
| Sunday | 35 |
It is clear that Sunday =35 is the highest.
So the answer is Sunday.
C) What was the minimum actual temperature during the week?
From the table we can see that,
| Day | Actual temperature |
|---|---|
| Monday | 17.5 |
| Tuesday | 20 |
| Wednesday | 30 |
| Thursday | 15 |
| Friday | 15 |
| Saturday | 25 |
| Sunday | 35 |
From these, it is clear that Thursday and Friday is the minimum i.e., 15.
So the answer is Thursday and Friday.
D) On which day did the actual temperature differ the most from the forecast temperature?
| Day | Actual temperature | Forecast temperature |
|---|---|---|
| Monday | 17.5 | 15 |
| Tuesday | 20 | 20 |
| Wednesday | 30 | 25 |
| Thursday | 15 | 27.5 |
| Friday | 15 | 15 |
| Saturday | 25 | 30 |
| Sunday | 35 | 35 |
We need to find which day the temperature differs the most.
| Day | DifferenceTemperature |
|---|---|
| Monday | 2.5 |
| Tuesday | 0 |
| Wednesday | 5 |
| Thursday | −12.5 |
| Friday | 0 |
| Saturday | −5 |
| Sunday | 0 |
Clearly we can see that −12.5 i.e., Thursday.
So the answer is Thursday.
Note: In such a graphical question, it isn’t necessary to draw the table unless mentioned in the question, but you need to be more careful when noting the values directly from the graph.