Question
Question: The following distribution gives the daily income of \(50\) workers of a factory. Daily income(i...
The following distribution gives the daily income of 50 workers of a factory.
| Daily income(in Rs) | 100−120 | 120−140 | 140−160 | 160−180 | 180−200 |
|---|---|---|---|---|---|
| Number of workers | 12 | 14 | 8 | 6 | 10 |
Convert the distribution above to a less than type cumulative frequency distribution, and draw its ogive.
Solution
To represent the data in the table graphically, we mark the upper limits of the class intervals on the x-axis and their corresponding cumulative frequencies on the y-axis by choosing a convenient scale.
Complete step-by-step answer:
The frequency distribution table of less than type is as follows:
| Daily income(in Rs)(Upper class limits) | Cumulative frequency |
|---|---|
| Less than 120 | 12 |
| Less than 140 | 12+14=26 |
| Less than 160 | 26+8=34 |
| Less than 180 | 34+6=40 |
| Less than 200 | 40+10=50 |
Now, taking upper class limits of class intervals on x-axis and their respective cumulative frequencies on y-axis and then plot the points (120,12),(140,26),(160,34),(180,40)&(200,50).
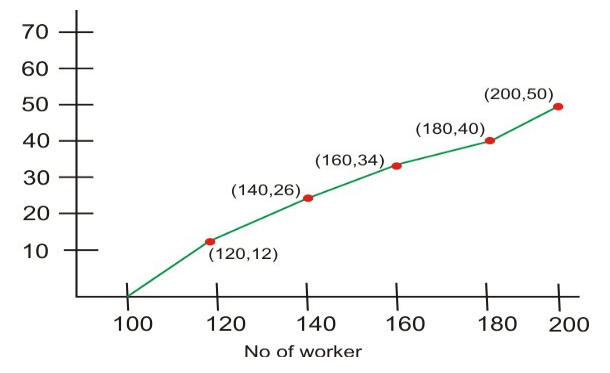
Note: In less than type cumulative frequency curve or an ogive, the points are plotted in the ordered pairs given by (Upper limit, Corresponding cumulative frequency).