Question
Quantitative Ability and Data Interpretation Question on Bar Graph
The following bar graph gives the production, exports and per capita consumption of rice in country A, for the five years from 2006 to 2010.
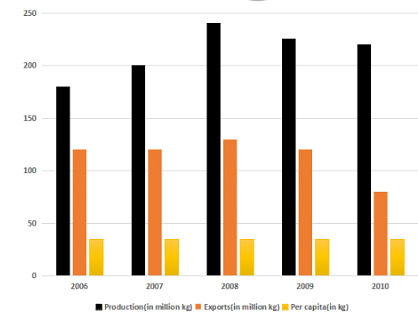
Consumption = Production - Exports Per Capita Consumption = (Consumption) (Population)