Question
Question: The first vertical line in the diagram represents a thermometer with the melting point for ice and d...
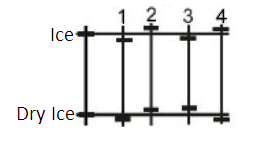
The first vertical line in the diagram represents a thermometer with the melting point for ice and dry ice (melting point of ice is greater than that of dry ice) at normal atmospheric pressure. The numbered vertical lines represent possible melting points of both the substances at 10 atmospheric pressure. Which vertical line best represents the melting points of both the substances at 10 atmospheric pressure relative to the respective values at normal atmospheric pressure?
Note: The differences in temperatures are not to the scale.
A.1
B.2
C.3
D.4
Solution
You can use Le-chatelier’s principle to answer this question. It is used to predict the effect of changes like change in temperature or pressure on a system which is in equilibrium. It is also known as equilibrium law.
Complete step by step answer:
Here, it is given that the first vertical line in the diagram represents a thermometer with the melting point for ice and dry ice at normal atmospheric pressure. The numbered vertical lines represent possible melting points of both the substances at 10 atmospheric pressure.
We have to find the vertical line best which represents the melting points of both the substances at 10 atmospheric pressure relative to the respective values at normal atmospheric pressure.
According to Le-chatelier’s principle, If a system is in equilibrium and there is a disturbance that causes any change in the system’s equilibrium then the system will react in such a way so that the effect of the disturbance is minimized.
Since here ice and dry ice are at equilibrium then as the pressure is increased the melting point increases for dry ice .But water is the only liquid whose melting point decreases with increase in pressure as water expands when it goes from liquid to solid phase.
So line 3 is the vertical line which correctly represents the melting point of both substances at 10 atm pressure.
Hence the correct answer is C.
Note:
We can also use the clausius clapeyron equation which gives the relationship between pressure and temperature to explain the change which occurs in equilibrium between two phases. It is given as-
logP1P2=RΔH(T21−T11)
Here, P is the pressure, T is temperature,ΔH is change in enthalpy. The numbers indicate phase one and phase two.