Question
Question: The figure shows two paths for the change of state of gas from A to B. The ratio of molar heat capac...
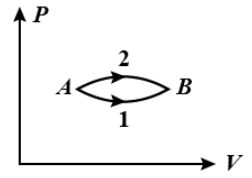
The figure shows two paths for the change of state of gas from A to B. The ratio of molar heat capacities in path 1 and path 2 is
A. < 1
B. > 1
C. 1
D. Data insufficient
Solution
This question can be solved using the formula that relates the internal energy of the gas and the heat capacity of that gas. For the given two paths, we will derive two different equations, and then, we will find the ratio of these equations in terms of the molar heat capacities.
Formula used:
Q=nCΔT
ΔU=nCvΔT
Q=ΔU+W
Complete step by step answer:
The formula that relates the heat and the heat capacity of an ideal gas is as follows.
Q=nCΔT
Where Q is the heat, n is the number of moles, C is the molar heat capacity (can be a constant pressure or can be at constant volume) and ΔTis the change in the temperature.
Express the above equation in terms of the molar heat capacity. So, we get,
C=nΔTQ
As the gas chooses two paths to change the state from A to B, so, the number of moles of the gas and the change in the temperature remains the same for both the processes.
So, the above equation can be rewritten as follows.
C∝Q….. (1)
The internal energy is given by the formula,
ΔU=nCvΔT
Where n is the number of moles, Cv is the molar heat capacity at a constant velocity and ΔTis the change in the temperature.
Cvwill be a constant value and as the parameters n and ΔTremains constant, thus, in turn, the internal energy remains constant.
The work done by the gas is,
Q=ΔU+W
The work done will be the area under the curve. So, from the given graph, it’s clear that the work done under the curve for path 2 is more than the work done under the curve for path 1.
W2>W1
As the change in the internal energy is constant, so, we can write,
Q2>Q1
As, from the equation (1), we have, C∝Q. So, we get,