Question
Question: The figure shows the variation of photocurrent with anode potential for a photo-sensitive surface fo...
The figure shows the variation of photocurrent with anode potential for a photo-sensitive surface for three different radiations. LetIa, Ib and Ic be the intensities and υa,υb and υc be the frequencies for the curves a, b and c respectively. Then:
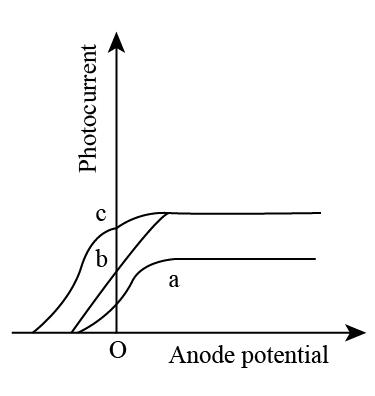
A. υa=υb and Ia=Ib
B. υa>υc and Ia=Ic
C. υa<υb and Ia=Ib
D. υb=υc and Ib=Ic
Solution
The intensity of saturation is directly proportional to intensity and stopping potential is directly proportional to the frequency. On the basis of this statement we will be establishing the relationship between potential and frequency to find out which option is correct.
Complete step by step solution:
We know that the stopping potential is directly proportional to the frequency.
VSt.∝υ……(1)
Using equation (1) and closely observing the given figure, we can state that the stopping potential of curve a and curve b is directly proportional to their respective frequencies.
Va∝υa......(2)
Vb∝υb……(3)
On dividing equation (2) and equation (3), we get:
VbVa=υbυa……(4)
It can also be observed from the figure that stopping potential for curve a and b are equal.
{V_a} = {V_b}\\\ \dfrac{{{V_a}}}{{{V_b}}} = 1 \end{array}$$ Substitute $$\dfrac{{{V_a}}}{{{V_b}}} = 1$$ in equation (4) $$\begin{array}{l} 1 = \dfrac{{{\upsilon _a}}}{{{\upsilon _b}}}\\\ {\upsilon _a} = {\upsilon _b} \end{array}$$ We also know that the intensity of saturation is directly proportional to the intensity. $${I_{sat.}} \propto I$$……(5) Again by closely observing the figure and using equation (5), it can be stated that the intensities of curve a, b and c are not equal. $${I_a} \ne {I_b} \ne {I_c}$$ **Therefore, the option (A) that is $${\upsilon _a} = {\upsilon _b}$$ and $${I_a} \ne {I_b}$$ is correct.** **Note:** While writing the individual equations for relationship between potential and frequency of curve a and b do not confuse in removing the proportionality sign to find a relation between potential and frequency of curve a and b. Alternatively, rather than finding the ratio of potential of curve a and b we can substitute the value of potential of curve a equal to curve b which will come out to be the same as what we already got in our solution.