Question
Question: The figure shows a radiant energy spectrum graph for a blackbody at a temperature \( T \) . Identify...
The figure shows a radiant energy spectrum graph for a blackbody at a temperature T . Identify the graph which correctly represents the spectral intensity versus wavelength graph at two temperatures T and T′ ( T<T′ )
(A) 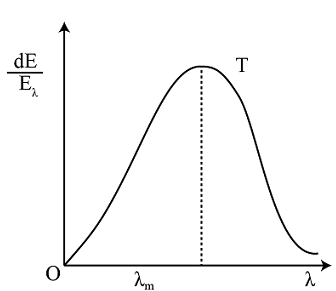
(B) 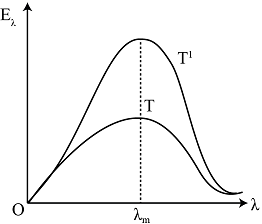
(C) 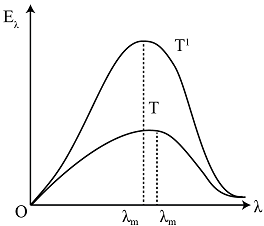
(D) 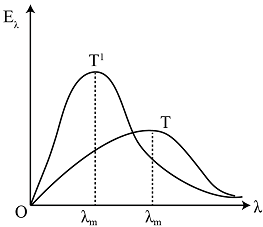
Solution
Here, you are given a radiant energy spectrum graph for a blackbody and spectral intensity versus wavelength graph at two different temperatures, you are asked to find the correct diagram. In order to answer this question, you need to figure out what concept can be used to determine the variation of intensity with respect to the wavelength of the radiation emitted by the blackbody at different temperatures.
Complete step by step answer:
Thermal radiations are electromagnetic waves like light once they are emitted by any body, so it obeys all the laws of wave theory. The wavelength is comparable to the dimensions of objects usually used and therefore the rules of geometrical optics are valid such as the radiation travels in a straight line, shadows are casted, reflection and refraction also happens at the boundary of two media. The above discussion was to prepare a background of radiation and let you know that radiations are basically electromagnetic waves and it is obvious that the wave will have some wavelength. The radiation that is emitted by a body is a combination of various waves of different wavelengths but only a range of wavelengths has significance if we talk about contribution to the radiation. The temperature of the radiating body has a great effect on the wavelength. The nature of thermal radiation is studied by the graph of intensity versus the wavelength. According to this, when the temperature is increased, the wavelength corresponding to the maximum intensity shifts to the left, meaning that the wavelength decreases. The relation is given by the Wien’s displacement law as λmT=b , where b is a constant. So, the graph depicting correctly the spectral intensity versus wavelength graph should be the second graph.
Option (B) is correct.
Note:
The thing to note here is that option (C) also satisfies the conditions we have discussed but it was brief. The reason why option (C) is incorrect because the curve with temperature T is greater than the curve with temperature T′ which is not possible. The curve with high temperature should always lie above the curve with comparatively low temperature.