Question
Question: The figure given below shows sound waves formed in the same time interval. Which diagram shows a bas...
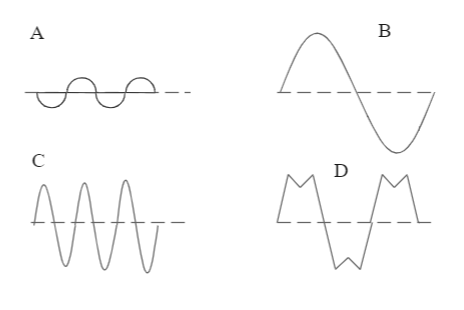
The figure given below shows sound waves formed in the same time interval. Which diagram shows a bass (low frequency) note?
Solution
Hint
A wave is a propagating dynamic disturbance in a medium. It travels with the help of crests and troughs that are the highest and the lowest points in a wave, respectively .An interval of the wave is the time period for which it travels, and parameters like the frequency and wavelength of the wave depend on this interval.
Complete step by step answer
A wave is a variation or disturbance that transfers energy progressively from point to point in a medium. It is capable of taking the form of a variation of pressure or elastic deformation,electric or magnetic intensity, electric potential, or temperature. The frequency of a wave is the number of periods or complete waves in a given time period.
The given question is asking us to find the wave with a low frequency. Since, all the waves have the same interval, the lowest frequency will be of the one with the least number of complete waves. We can see that wave A has 2 waves, while wave B has 1. Wave C has 3, and wave D also has 3 complete waves.
Hence, our required wave motion is the one exhibited by wave B.
Note
Musical instruments are known to produce sound by causing the matter to vibrate. These vibrations move through the air and convert into the melodies that we hear. For string instruments, the speed and length of the plucking of the wire determines the frequency of the vibrations produced. Bass instruments have very low frequency and are designed to accommodate this property.