Question
Question: The driver of a car travelling at \(52km{{h}^{-1}}\) applies the brake and accelerates uniformly in ...
The driver of a car travelling at 52kmh−1 applies the brake and accelerates uniformly in the opposite direction. The car stops in 5s. Another driver going at 3kmh−1 in another car applies his brakes slowly and stops in 10s. On the same graph paper, plot the speed versus time graphs for the two cars. Which of the two cars travelled farther after the brakes were applied?
Solution
Hint: In a velocity-time graph, the slope is given by the acceleration of the body. This is because acceleration is nothing but the change in velocity per second of a body. If the body is decelerating, it will have a negative slope. The total area under a velocity-time graph gives the displacement of the body. This is because velocity is the change in displacement per second of the body.
Formula used:
In a velocity time graph,
a=ΔtΔv
where a is the acceleration of the body, Δv is the change in velocity of the body in a time period Δt. Hence, acceleration forms the slope of a line in the velocity time graph.
s=t=0∑t=tvΔt
Where s is the displacement covered by the body. That is, the area under a velocity time graph is the displacement covered by the body.
The equation of a line with a point (x1,y1)on it and slope mis given by
y−y1=m(x−x1) --(2)
Complete step by step answer:
In a velocity time graph,
a=time periodfinal velocity-initial velocity=ΔtΔv --(1)
where ais the acceleration of the body, Δv is the change in velocity of the body in a time period Δt. Hence, acceleration forms the slope of a line in the velocity time graph.
The equation of a line with a point (x1,y1)on it and slope mis given by
y−y1=m(x−x1) --(2)
Hence, to plot the velocity-time graphs of the two bodies we will require the initial and final velocities of the bodies and the time interval in which there was acceleration.
For the first car,
Initial velocity of the car u1=52kmh−1=52×185=14.44m.s−1
Final velocity of the car v1=0
Time period Δt=5s
Therefore, using (1),
Acceleration a=50−14.44=−2.89m.s−2
Hence, slope of plot =−2.89m.s−2 --(3)
Now, one point on the plot is (5,0)--(4)
since, the car comes to rest at t=5s
Hence, using (2), (3) and (4), the equation for the plot will be
v−0=−2.89(t−5) --(5)
Similarly for the second car,
Initial velocity of the car u2=3kmh−1=3×185=0.83m.s−1
Final velocity of the car v2=0
Time period Δt=10s
Therefore, using (1),
Acceleration a=100−0.83=−0.083m.s−2
Hence, slope of plot =−0.083m.s−2 --(6)
Now, one point on the plot is (10,0)--(7)
since, the car comes to rest at t=10s
Hence, using (2), (6) and (7), the equation for the plot will be
v−0=−0.083(t−10) --(8)
Therefore using (5) and (8) to plot the two lines, we get,
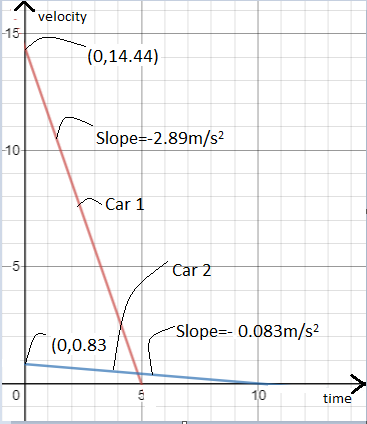
Now, displacement covered by car 1 is the area under its velocity time graph.
Therefore, it is the area of the triangle whose sides are the red line and the two positive axes.
Therefore, displacement of car 1 will be,
21×base×height (since this is the area of a triangle).
From the graph, we plug in the corresponding values and get,
=21×5×14.44=36.1m
Similarly displacement of car 2 will be,
21×base×height (since this is the area of a triangle).
From the graph, we plug in the corresponding values and get,
=21×10×0.83=4.15m
Hence, clearly, car 1 travelled further after the brakes were applied.
Note: One should always remember the relations between graphs of displacement, velocity and acceleration with time and the significances of certain curves in them. A lot of tricky questions can be based upon these graphs as they are not very intuitive to everyone.
A good way to understand tricky graphs in such questions is to break them into smaller parts and analyze each part separately. For example, in this question, we broke the question into two parts (one for the first car and the other for the second) and solved individually for each. Then we plotted them together. A single graph containing a lot of turning points and curves can also be broken down into individual parts and analyzed separately for better and quicker understanding.A common mistake that could happen in these problems is that students tend to forget that deceleration gives rise to a negative slope. Since it is more intuitive to many, they think that acceleration will always form a positive slope. However, this is completely wrong and the student will end up making a completely wrong graph.